Ethereum price is emphatic, ETH targets $1,800 as support fails
- Ethereum price drops through the lower trend line of a longstanding symmetrical triangle with a 7% down day.
- A break below $2,259 accelerates a decline, possibly to the 200-day simple moving average (SMA) at $1,841.
- IntoTheBlock IOMAP metric highlights imposing resistance at the triangle’s lower trend line and scarce support until $2,000.

Ethereum price has not been spirited higher during the recent bounce in Bitcoin. Instead, the smart contracts giant has been locked in a symmetrical triangle, struggling to hold the lower trend line. Similar to other altcoins, ETH increasingly faces a bearish fate moving forward unless a compelling catalyst emerges.
Ethereum price needs time, investors need patience
Ethereum price has sketched an uneventful path since the initial rebound from the May 19 low, unable to sustain any rally above the 50-day SMA or fracture the triangle’s upper trend line. As a result, ETH, along with most altcoins, has taken on a higher risk status than Bitcoin, prompting a slow exodus of committed investors, as reflected in the absence of any accumulation in the triangle.
Ethereum price has now severed the triangle’s lower trend line, opening up the potential for a notable decline. Critical to preventing the decline is the interaction of the June 12 low of $2,259 with the 50% retracement at $2,237. A failure to resist the selling pressure reveals a journey to the confluence of the 200-day SMA at $1,841 with the anchored volume-weighted average price (anchored VWAP) at $1,830.
Suppose a test of the 200-day SMA and anchored VWAP fails. In that case, another resistance level of importance is the intersection of the 61.8% Fibonacci retracement at $1,730 with the May 23 low of $1,728, representing a decline of 26% from the current price. Any ETH weakness beyond this level would be a surprise at this point in the analysis.
Despite trading down almost 50% from the May 12 high of $4,384, Ethereum price has not activated any emotion or commitment in the digital asset. A reminder that ETH investors may need lower prices to stimulate heavy bidding.
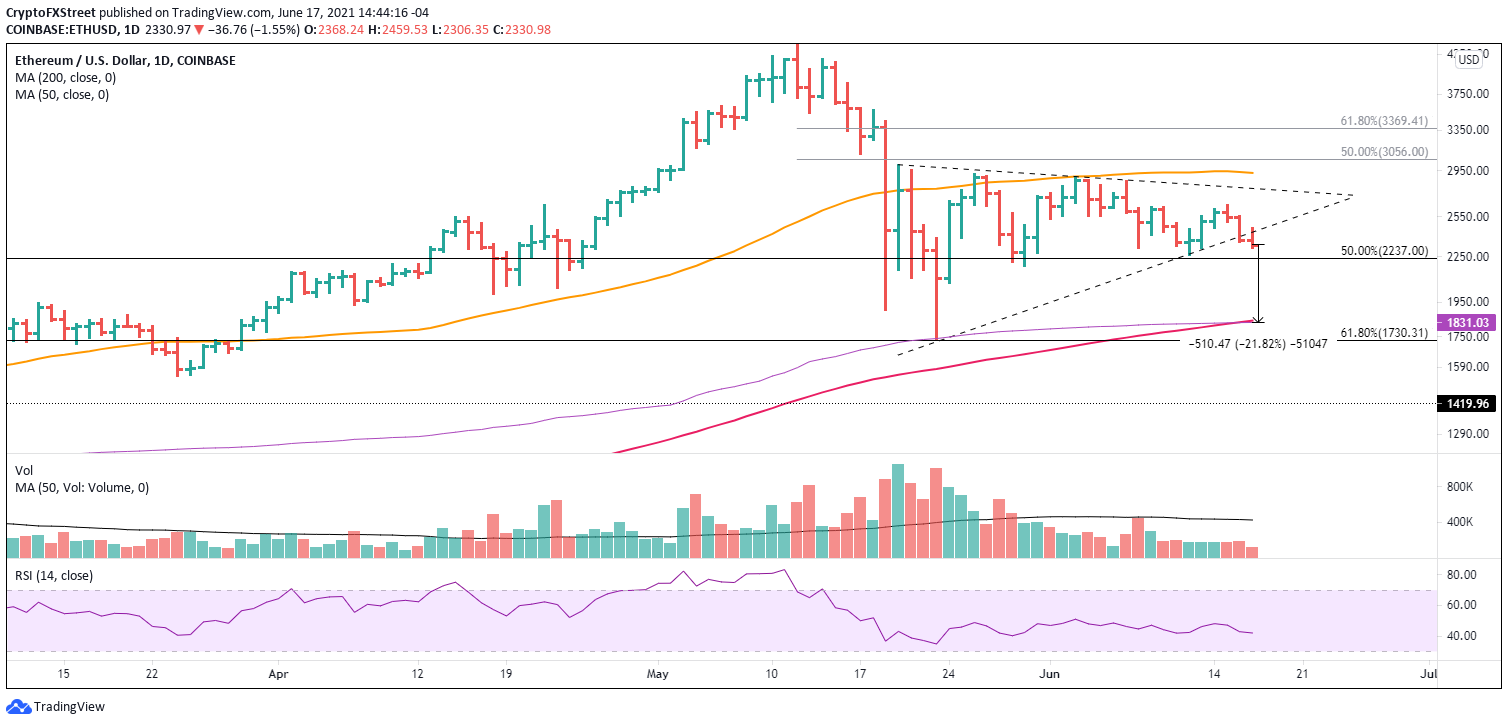
ETH/USD daily chart
It would take a daily close above the June 15 high of $2,640 to realistically entertain a sustainable thrust higher for Ethereum price. A close above the 50-day SMA at $2,928 would be welcomed confirmation of a new, viable uptrend with ETH sights set on the all-time high of $4,384.
A potential disruption for the bearish ETH outlook is the upcoming London hard fork update to address energy use and higher transaction fees. Excitement about the update may limit any future decline and place a foundation for Ethereum price to rally higher through the price barriers mentioned above.
The IntoTheBlock In/Out of the Money Around Price (IOMAP) data communicates the support and resistance levels based on the number of addresses in or out of the money. In the money addresses are classified as support, and out of the money addresses are categorized as resistance.
The Ethereum IOMAP data distinguishes a large layer of resistance from $2,426 to $2,496, where 568.24K addresses hold 10.71 million ETH at an average price of $2,458. The average price locks onto the symmetrical triangle’s lower trend line, enforcing the adage that what was support is now resistance.
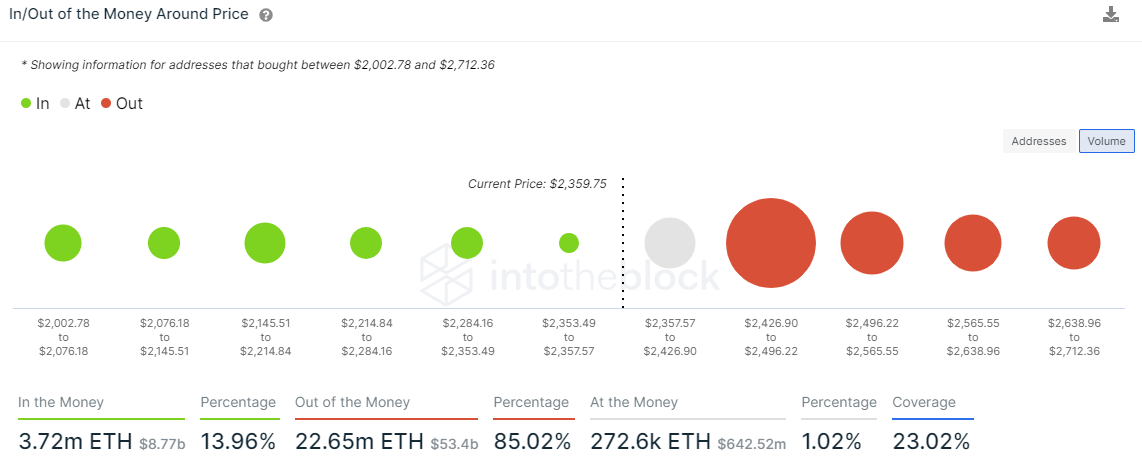
ETH IOMAP - IntoTheBlock
The IOMAP price clusters show no meaningful support down to the psychologically important $2,000, placing Ethereum price just above the anchored VWAP and the 200-day SMA.
A second on-chain metric restraining a neutral to bullish outlook is the plunge in the number of active addresses in the network, either as a sender or receiver. The greater the number of active users, the greater the popularity of the network.
The 14-day smoothed number of active addresses has fallen 25% from the peak and is now inching closer to the rising trend line from early 2020. A sustained break will have bearish ramifications for the long-term Ethereum price outlook and should be watched moving forward.
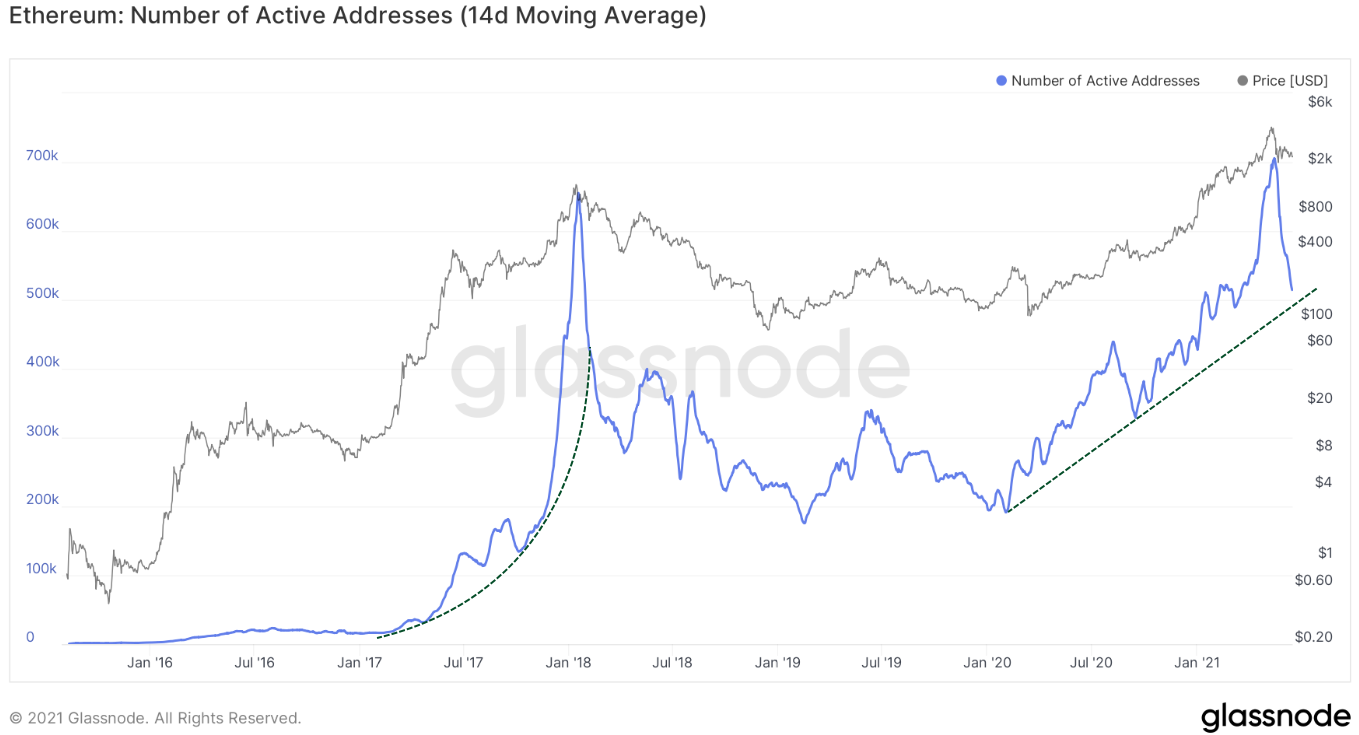
ETH Number of Active Addresses - Glassnode
Ethereum price is at a pivotal point after slashing through the symmetrical triangle’s lower trend line. ETH faces the pressure of significant resistance as outlined by the IOMAP and the sharp drop in the network’s popularity, referenced by the number of active addresses.
A mildly bearish bias seems appropriate based on the technical and fundamental metrics until a sustainable rally can be identified on the charts.
In the following video, FXStreet’s analysts evaluate why Ethereum price could drop to $2,300.
Author

Sheldon McIntyre, CMT
Independent Analyst
Sheldon has 24 years of investment experience holding various positions in companies based in the United States and Chile. His core competencies include BRIC and G-10 equity markets, swing and position trading and technical analysis.


