Ethereum Price Prediction: ETH eyes $250, but why are whales on a buying frenzy?
- Ethereum to holders increased their holdings in August by 84%, suggesting growing confidence in the crypto.
- Ethereum is forming a bearish flag pattern, and if rejection again at $360, the price could plummet to $250.

The smart contract cryptocurrency, Ethereum, has been pivotal between the key support at $320 and the critical resistance at $360 since September 5. The lock-step trading happens in the wake of a devastating fall from August highs at $489 to September’s support at $310.
At the time of writing, Ether is teetering at $342 amid a short term bullish bias. The Relative Strength Index (RSI) in the hourly timeframe confirms the growing bullish trend with a sharp spike above the midline.
ETH/USD hourly chart
 - 2020-09-09T105214.617-637352379625721183.png)
Ethereum whales continue filling their bags
According to Santiment, an on-chain data analysis platform, large holders of the second-largest cryptocurrency by market capitalization are not slowing down on stocking up. Ethereum holders with more than 10 million coins have continued to grow their holdings in August to highs above 5.80 million coins. Moreover, the graph shows the trend is not about to slow down despite the drop in the price in the first week of September.
There has also been a significant increase in investors' holdings with 100,000 to 1 million ETH. Ethereum held by this group plunged in the last week of August but is now picking up the pace fast.
Ethereum holder distribution
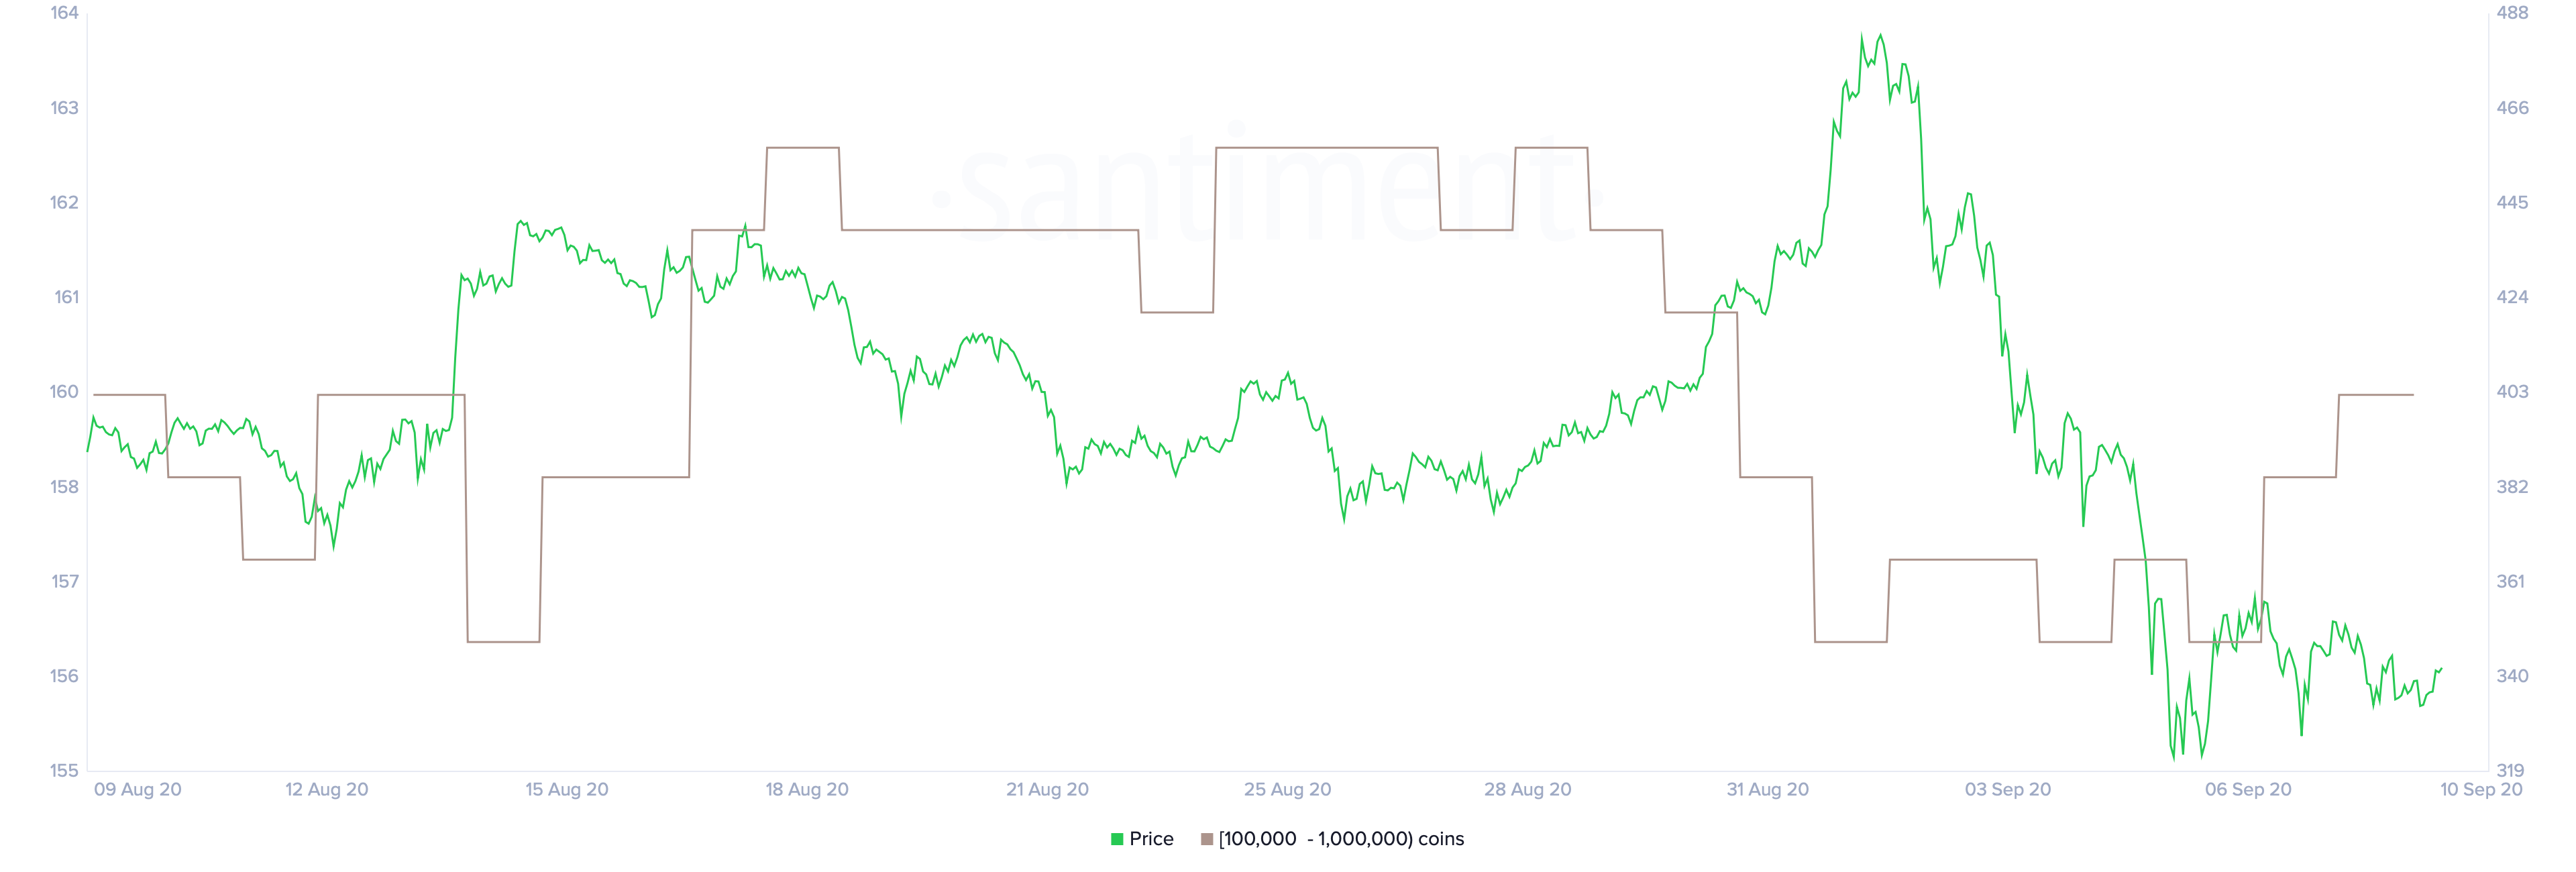
In August, top non-exchange whale addresses increased their holdings by 84% as per the data by Santiment. The top holdings increase suggests that large investors have faith that Ethereum will continue to grow in the coming months.
However, we will dive into the technical aspect to figure where the cryptocurrency is heading. Should you expect a drastic upswing or an already foreseeable downswing to $250?
Ethereum technical analysis
Ethereum price is at crossroads amid the formation of a bear flag pattern. If the short term bullish momentum continues to build towards $350 and breaks above the key resistance (former triangle support), then the next stop would be $400 and $450. However, a more probable move is rejection from the key resistance ($360), which later wound be pushed lower by the flag pattern's impact, bringing into the picture declines to $250 (buyer congestion area).
ETH/USD daily chart
 - 2020-09-09T113455.090-637352379109115495.png)
The RSI highlights just enough buying pressure to keep the price above $320 and $310 support areas. However, any increase in selling pressure could let hell loose on the second-largest cryptocurrency.
Author

John Isige
FXStreet
John Isige is a seasoned cryptocurrency journalist and markets analyst committed to delivering high-quality, actionable insights tailored to traders, investors, and crypto enthusiasts. He enjoys deep dives into emerging Web3 tren