Ethereum price may take a breather before it makes a new all-time high of $2,660
- Ethereum price is facing resistance around the middle line of an ascending parallel channel.
- Momentum Reversal Indicator (MRI) reveals a retracement could be underway.
- However, on-chain metrics remain strong, eying a 25% upswing to $2,657.

The Ethereum price faces a make-or-break moment as it traverses an ascending parallel channel.
Ethereum price at crossroads
On the daily chart, the Ethereum price has been forming higher highs and higher lows since January 12. Such a price action shows the creation of an ascending parallel channel when the swing points are joined using trend lines.
While the pattern shows a bearish bias, the smart contract platform’s bull run seems to be contained in this upward sloping channel. At the time of writing, ETH was facing resistance from the setup’s middle line around $2,120.
A decisive close above this level might propel Ethereum price by 25% toward the 141.4% Fibonacci extension level at $2,657. While the scenario is bullish without a doubt, buyers will need to slice through the supply barrier at $2,446, which coincides with the 127.2% Fibonacci extension level.
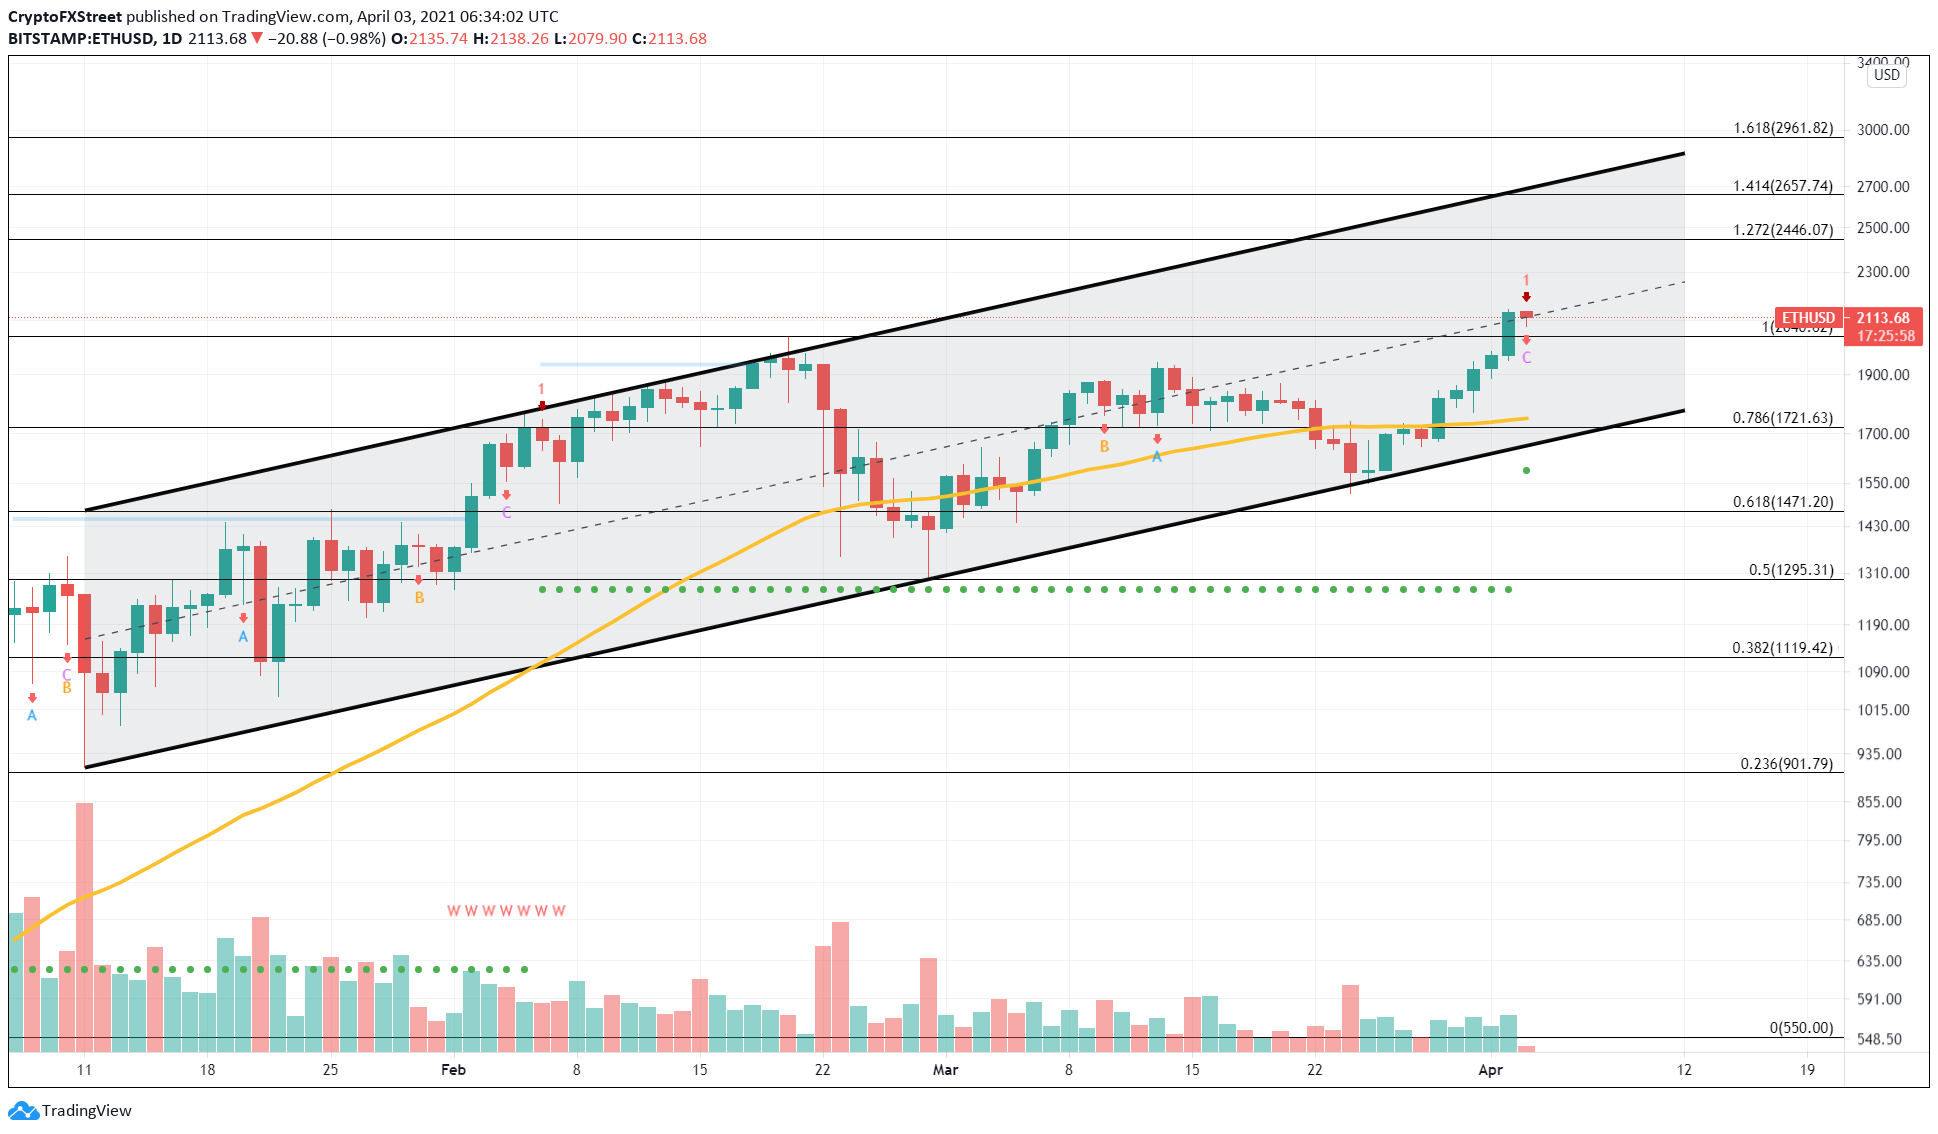
ETH/USD 1-day chart
Supporting this move into a price discovery phase and potentially setting up new highs is the daily active deposits metric. When Ethereum broke through the $2,000 level in mid-February, this metric spiked to 34,000 or 35,000 ETH, which eventually led to a crash.
Unlike last time, this number is hovering around 27,000 ETH, which is relatively low. Hence, investors can expect the $2,000 psychological level to sustain.
Further supporting the investors’ bullish sentiment is the low exchange inflow seen to exchanges. This behavior suggests that market participants are confident about ETH’s future.
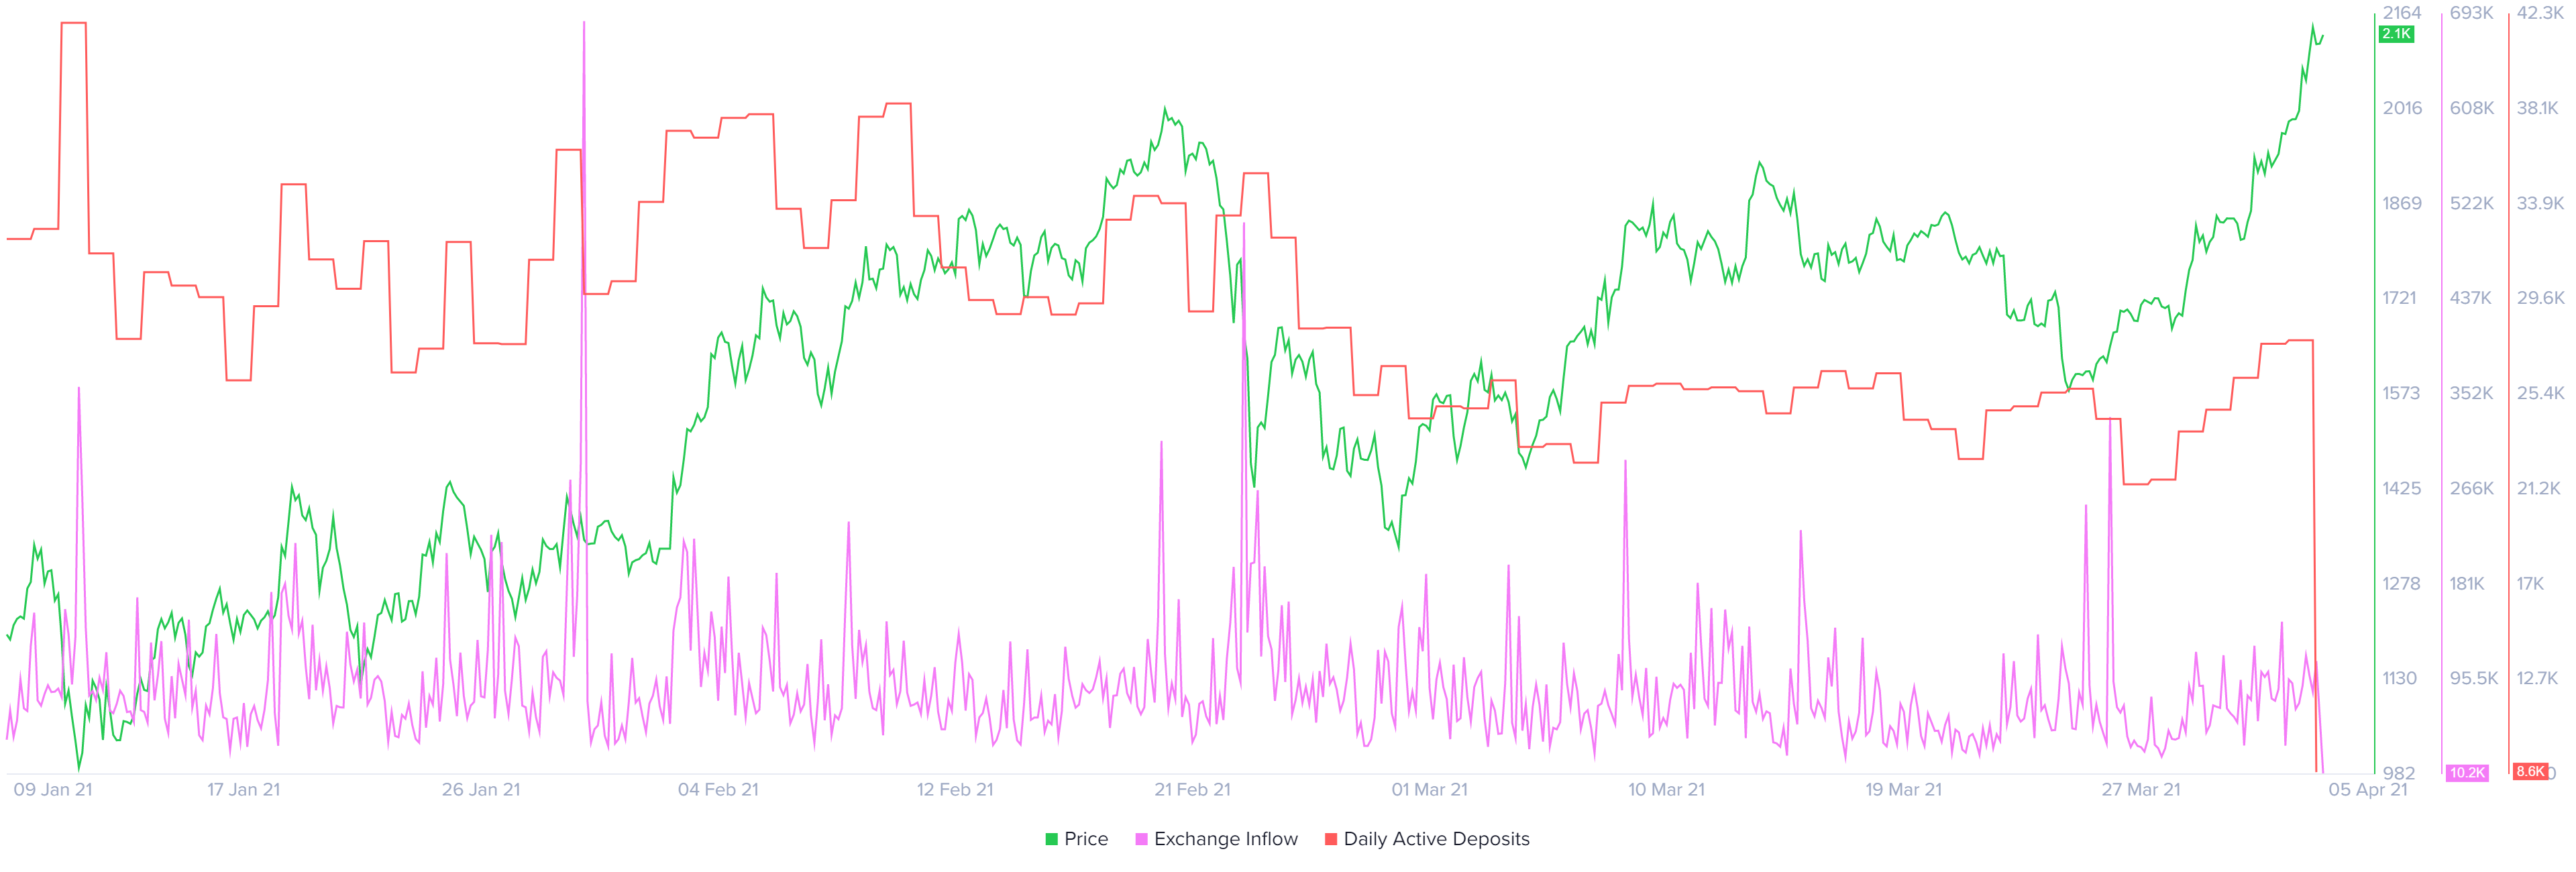
Ethereum daily active deposits and exchange chart
Ethereum supply on exchanges as a percentage of its total supply has hit 19.83%, a level last seen in late December 2018. In total, this metric has dropped 26% in the last year and shows that investors expect a further appreciation of ETH’s market value in the near future.
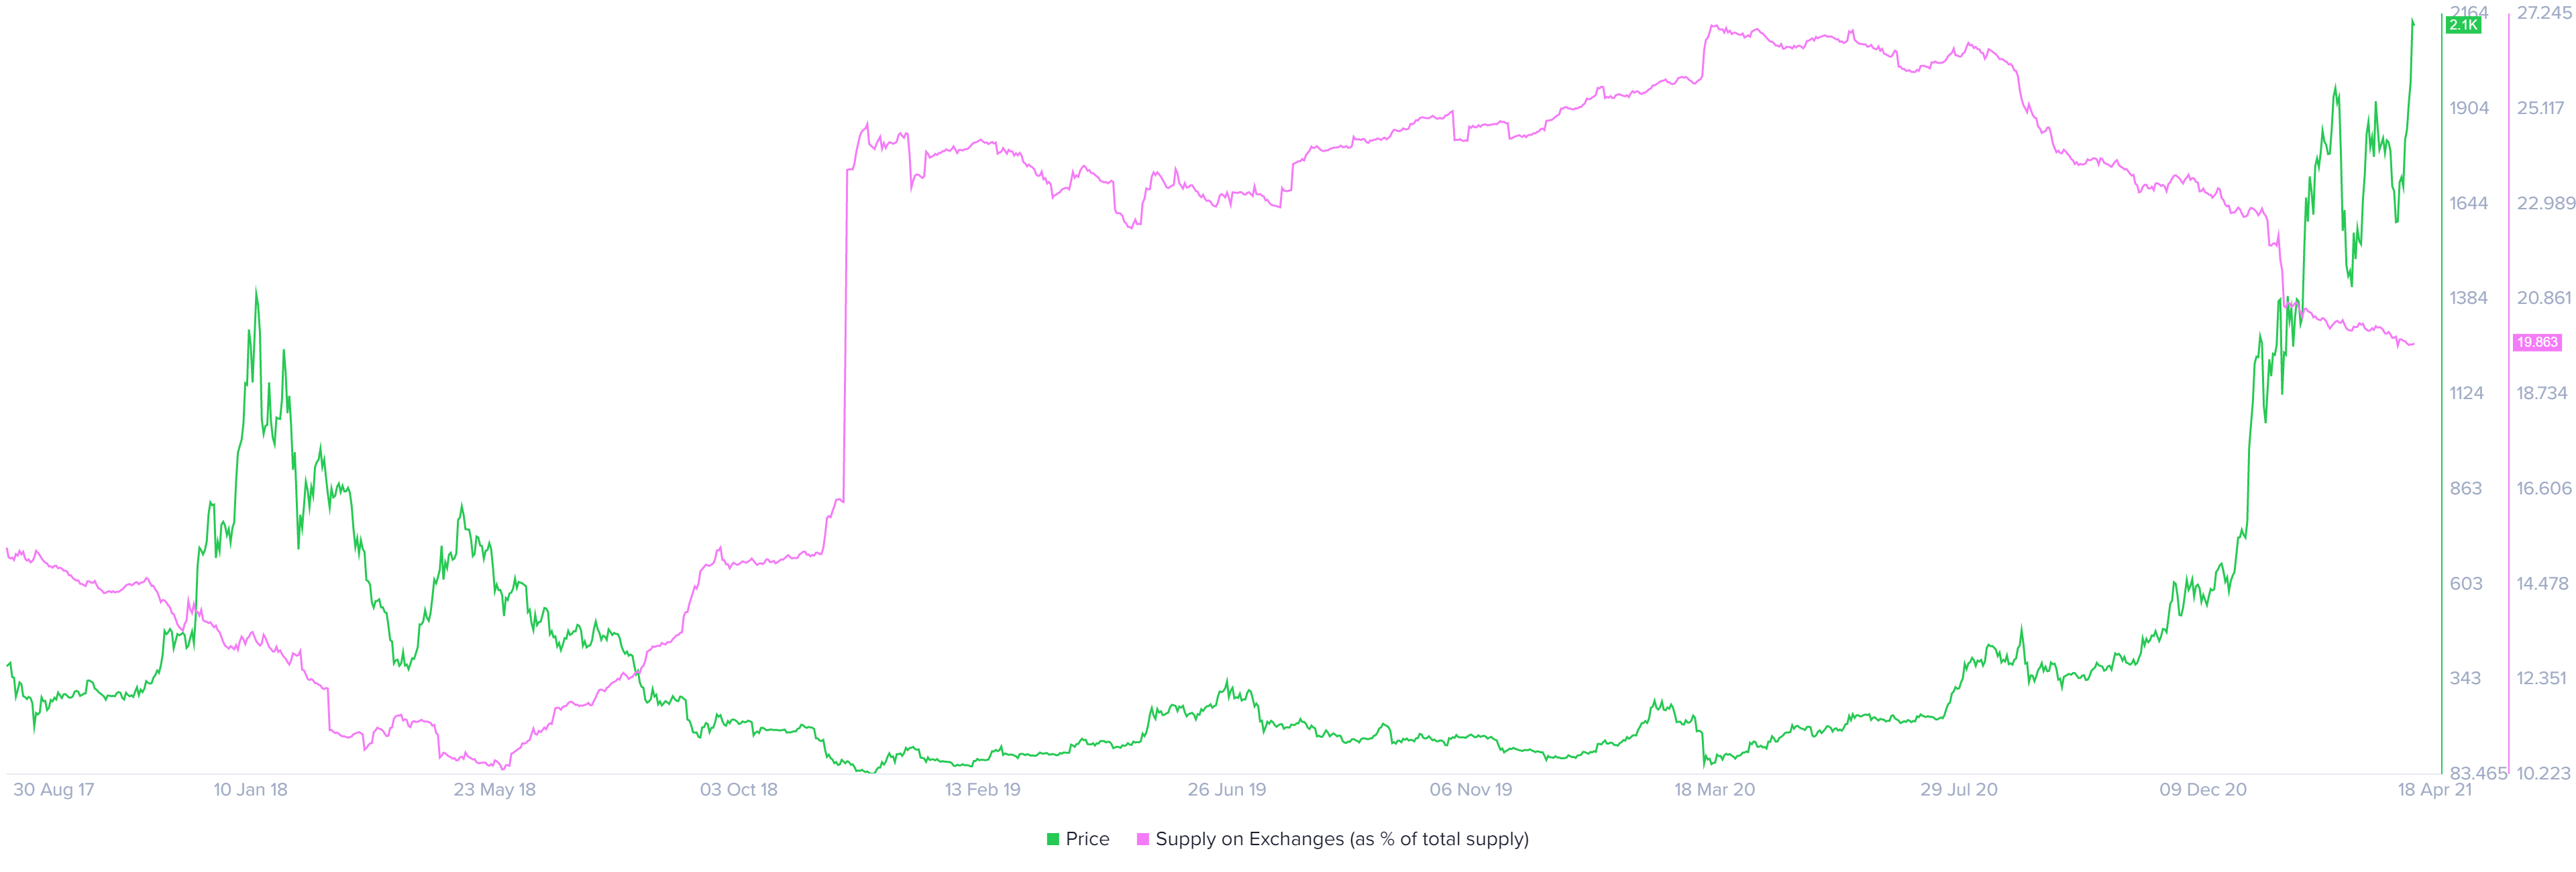
Ethereum exchange supply on exchanges
Finally, the number of whales holding between 1,000,000 to 10,000,000 ETH has increased by 11%, indicating a new addition in this category. More so, these investors’ holdings seem to affect Ethereum price moves directly. Hence, the recent spike paints a bullish picture.
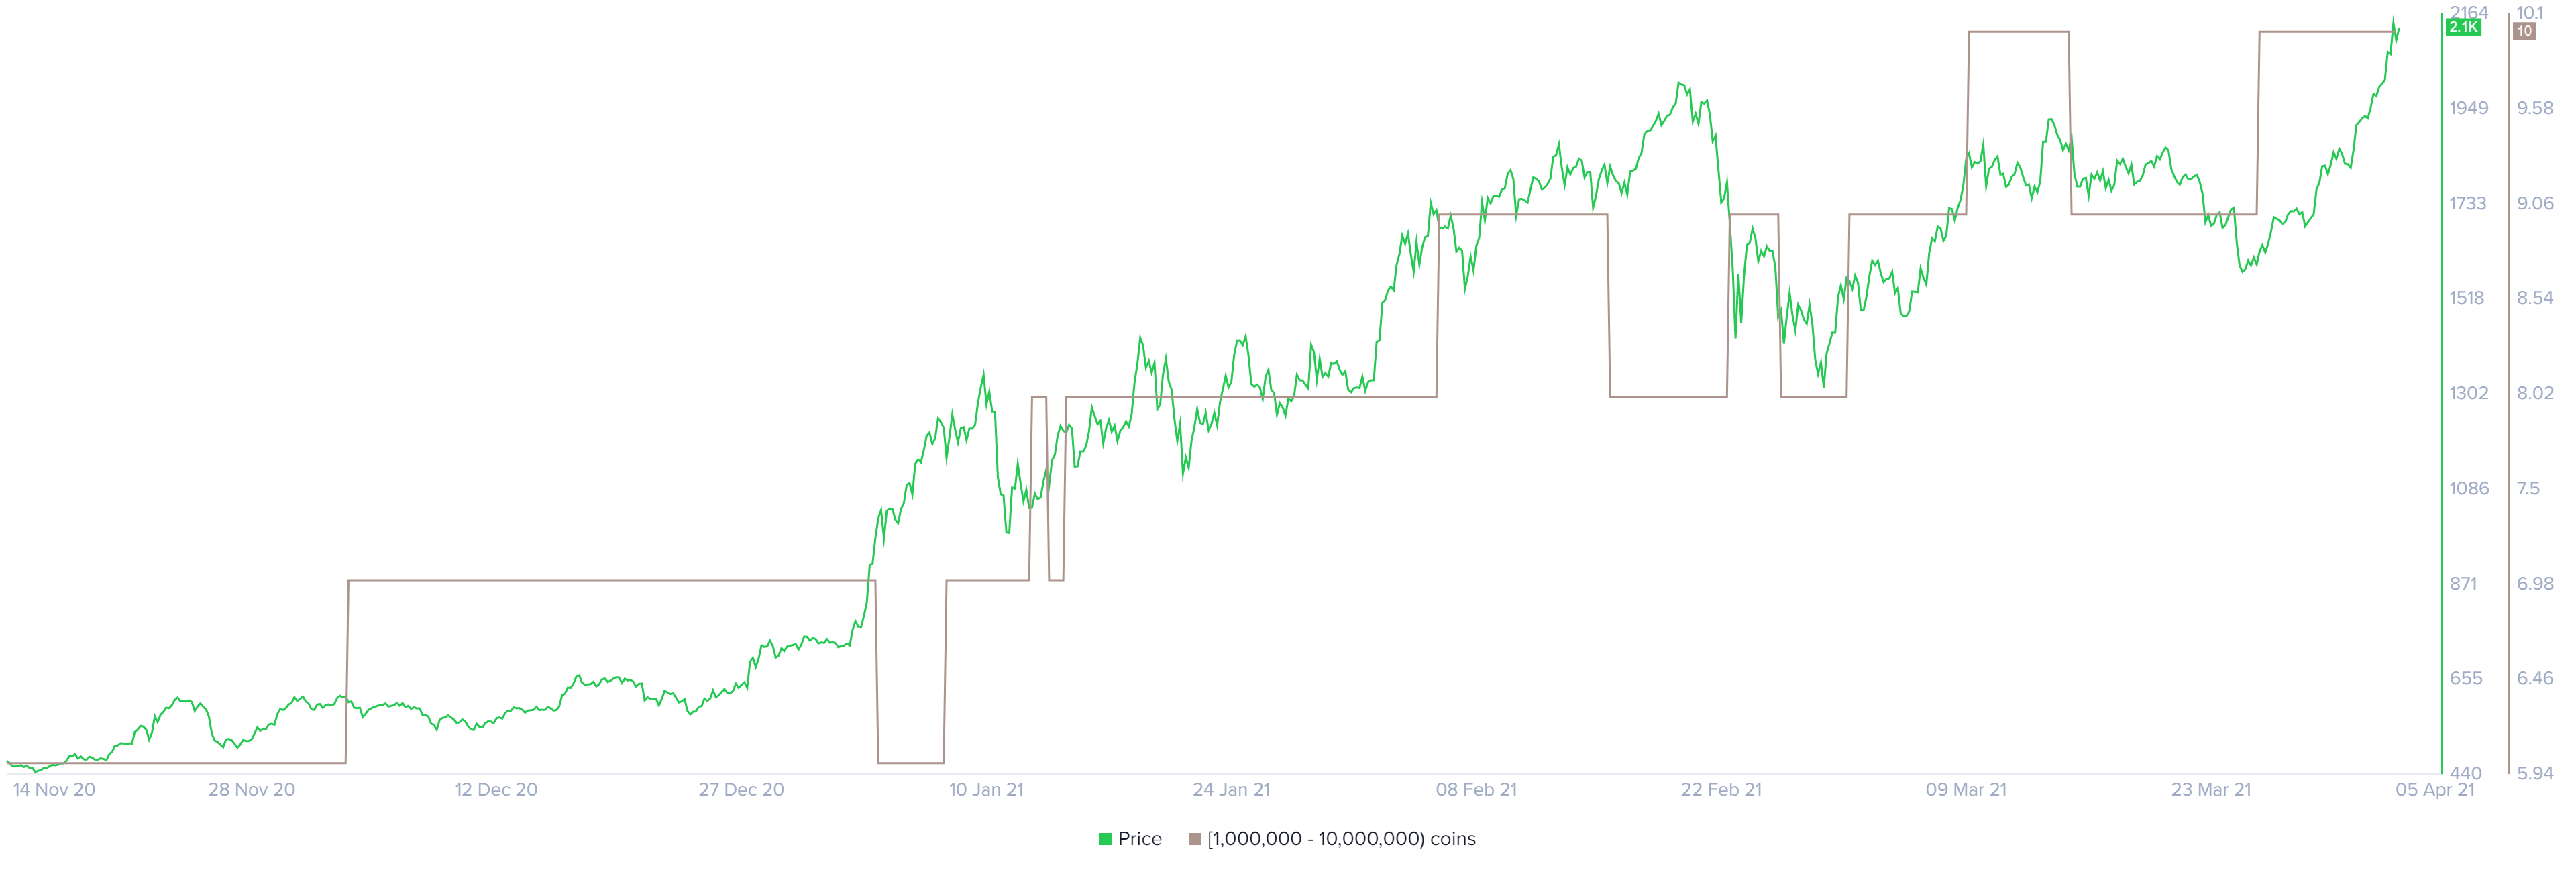
Ethereum whale holder distribution chart
While the on-chain metrics paint a bullish picture, the Momentum Reversal Indicator’s (MRI) flashed a reversal sign in the form of a red one candlestick on the daily chart. This setup forecasts a one-to-four candlestick correction.
What makes this signal compelling is the “extension C” for Ethereum’s overextended bull rally. Ethereum’s market value saw a 19% decline after extensions B and A were flashed on March 10 and 13, respectively. Hence, if something similar were to happen, ETH could be in trouble.
In case of a correction, the Ethereum price could be expected to slice through the immediate demand barrier at $2,040. Following this, the smart contracts token could then slide 15% to retest the ascending parallel channel’s lower trend line at $1,721. Interestingly, this support coincides with the 78.6% Fibonacci retracement level.
Author

Akash Girimath
FXStreet
Akash Girimath is a Mechanical Engineer interested in the chaos of the financial markets. Trying to make sense of this convoluted yet fascinating space, he switched his engineering job to become a crypto reporter and analyst.


