Top 3 Price Prediction Bitcoin, Ethereum, Ripple: Crypto market turns bullish as ECB president divulges CBDC details
- Bitcoin price is less than 5% away from reaching its all-time high at $61,788.
- Ethereum bulls show no signs of slowing down even after a 25% run-up in the last week.
- Ripple consolidates near the upper boundary of an ascending parallel channel.

Christine Lagarde, European Central Bank’s president, confirmed that the ECB governing council will reveal in mid-2021 its decision on whether to go forward or not with a digital euro, a Central Bank Digital Currency (CBDC).
Additionally, Lagarde mentioned that the ECB would soon submit the analysis of 8,000 responses from the consultation process regarding CBDC to the European Parliament.
After that, mid-2021, the governing council, on the basis of that consultation and the preliminary work that we are doing, will decide whether we go ahead with experimenting (with Digital Euro).
Lagarde also mentioned that this technical endeavor might take four years.
Bitcoin at make-or-break point
Bitcoin price has surged nearly 16% since it bounced off the 50 Simple Moving Average (SMA) on the daily chart. Now, BTC needs to climb less than 5% to reclaim the all-time high at $61,788 and even set up a new one.
Such a move is likely to trigger FOMO among sidelined investors, adding to the buying pressure and pushing BTC higher.
Adding credence to a positive outlook is the SuperTrend indicator’s buy signal, flashed after the Bitcoin price sliced through $59,200. If buyers continue to pile up, the pioneer cryptocurrency could indeed enter a price discovery phase.
In such a case, a 14% uptick in BTC price toward the 127.2% Fibonacci extension level at $70,780 seems likely. Subsequent areas of interest include $75,450 and $82,200.
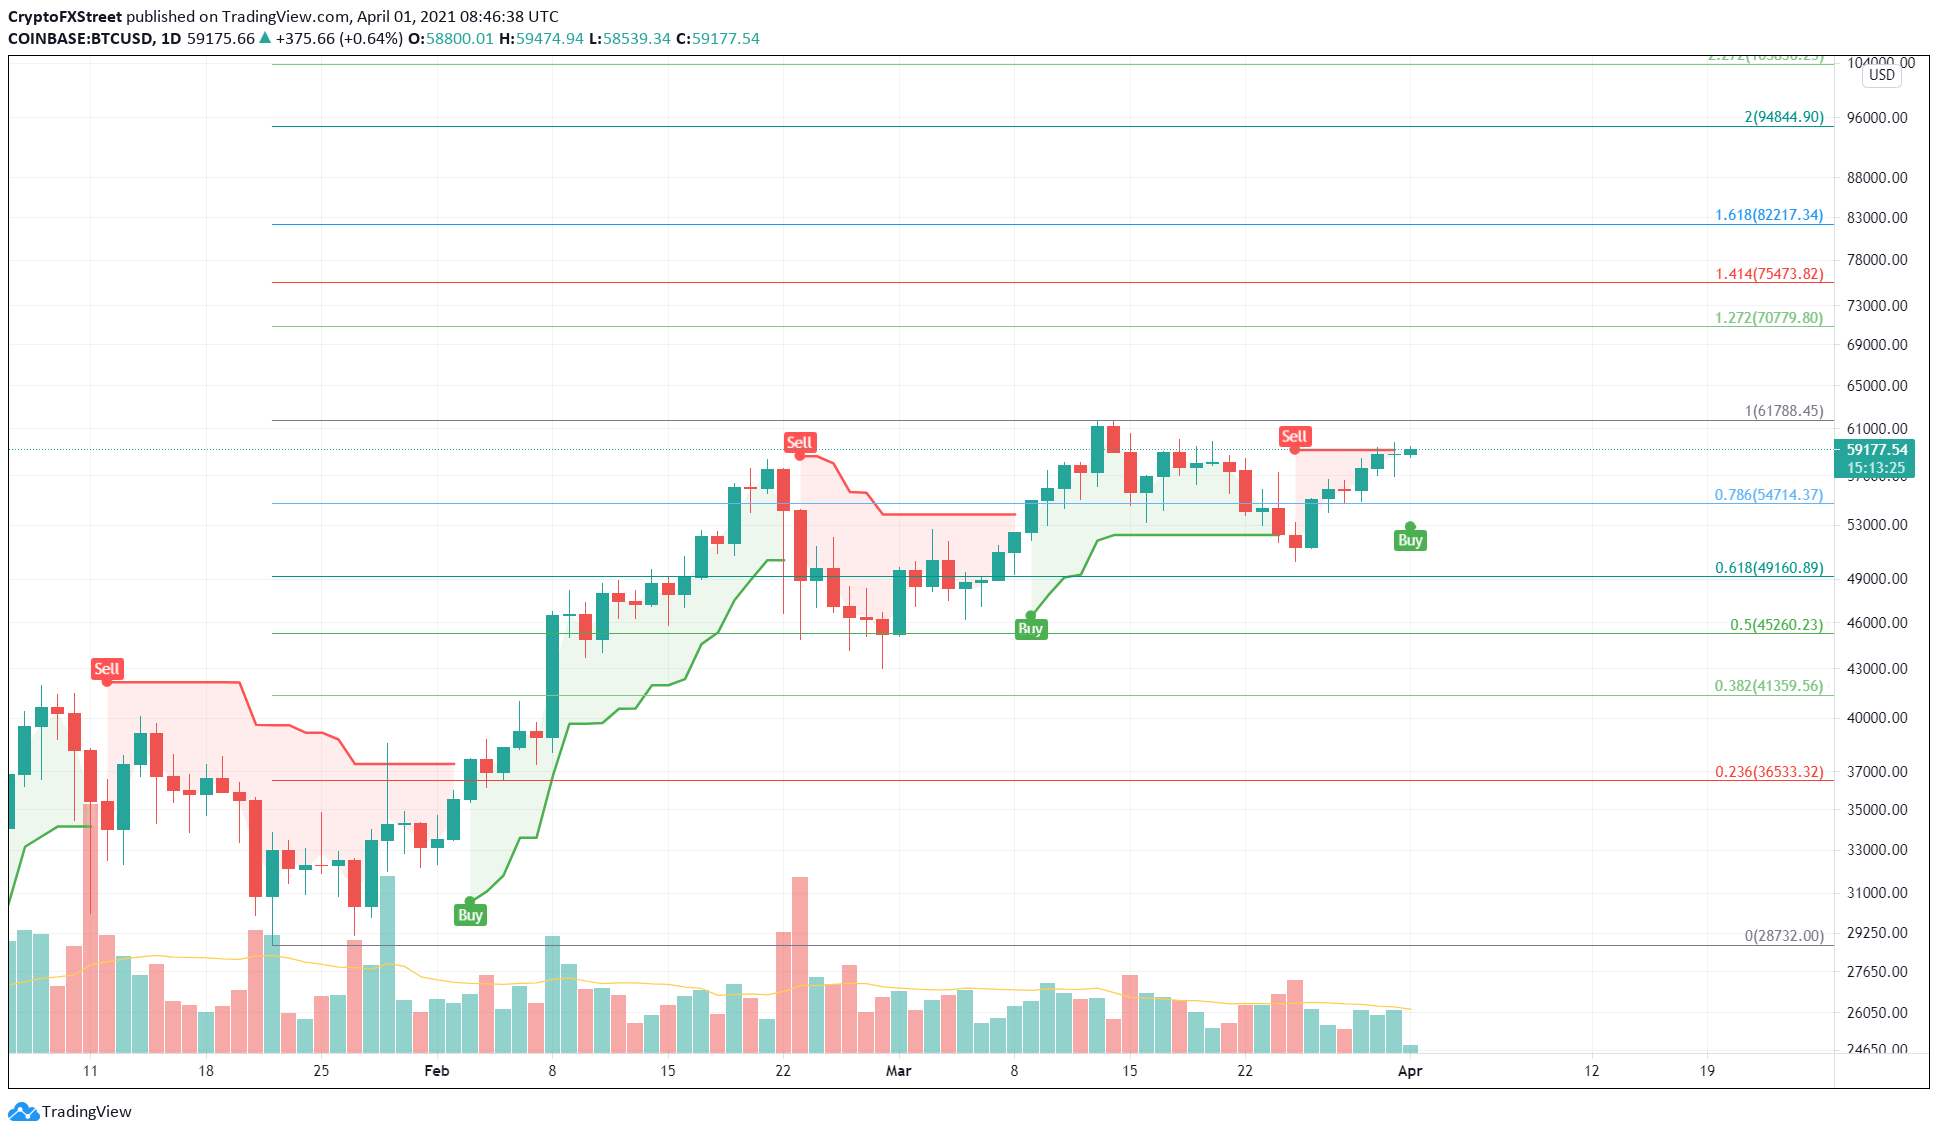
BTC/USD 1-day chart
Regardless of the bullish narrative, if investors decide to book profit near the all-time high, an 8% retracement to $56,700 seems plausible.
The persistence of bearish momentum here could extend the drop to $54,713 or the 78.6% Fibonacci retracement level.
Ethereum investors go on a buying spree
Etheruem price showed a massive burst of buying power around the 38.2% Fibonacci retracement level at $1,578, which resulted in a 25% bounce. This quick run-up has toppled the immediate supply barrier at $1,881, coinciding with the 78.6% Fibonacci retracement level.
Additionally, the SuperTrend indicator has triggered a buy signal after 161 days, which portrays this uptick’s importance for the ETH price.
Therefore, a continuation of this bullish momentum could quickly propel the smart- contracts platform token toward $2,500. Interestingly, this level coincides with the 161.8% Fibonacci extension level.
To do so, Ethereum bulls need to slice through crucial supply barriers that stand at $2,040 and $2,245.
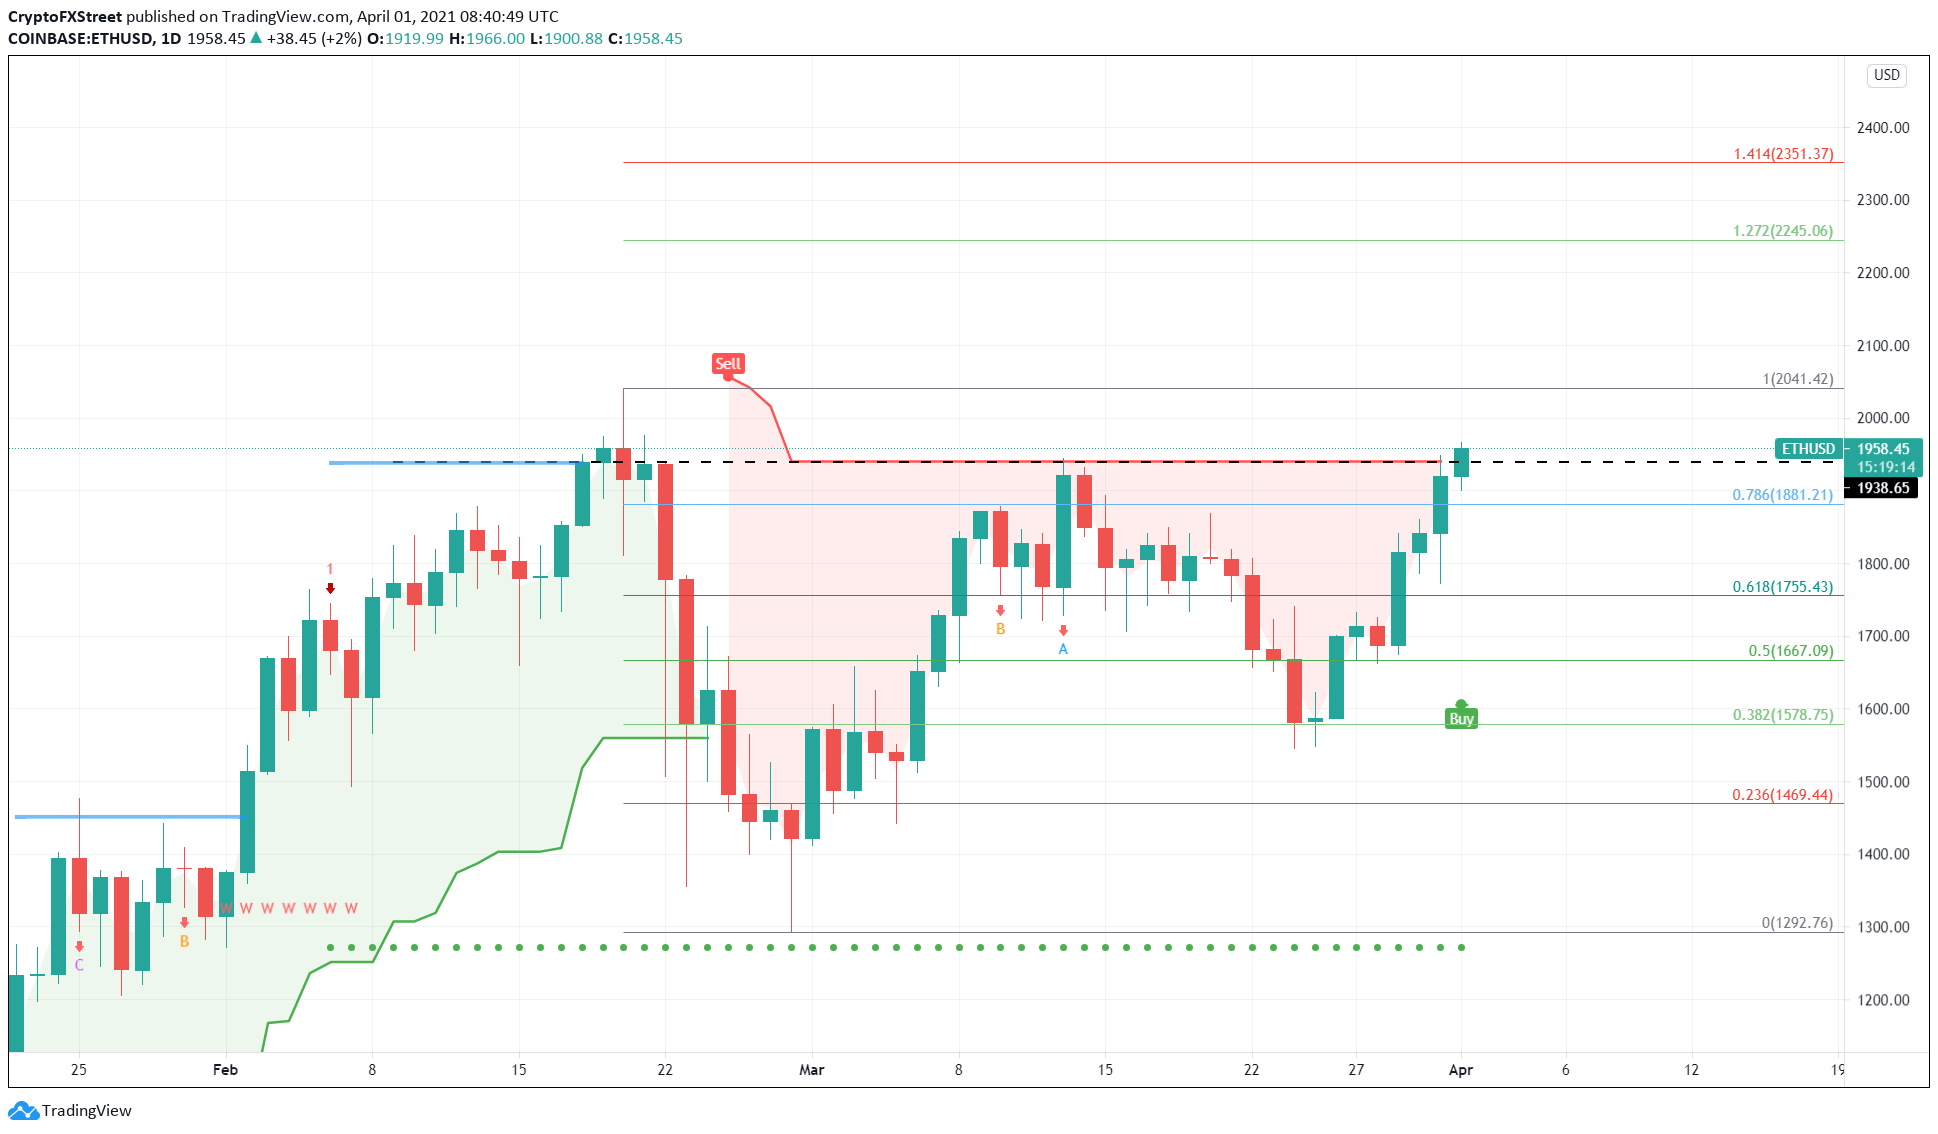
ETH/USD 1-day chart
Investors need to pay attention to Momentum Reversal Indicator’s breakout line at $1,940. A failure to produce a candlestick close above this level could signal buyers’ exhaustion. Here, if investors begin to reallocate their holdings or start booking profits, a downtrend seems likely.
In that case, Ethereum price could first slide 5% to retest the $1,881 demand barrier. If this level is overwhelmed by the sellers, ETH could crash 10% to the 61.8% Fibonacci retracement level at $1,755.
Ripple evaluates pullback as it approaches local top
Ripple price faces exhaustion of the bullish momentum as it approaches the upper trend line of an ascending parallel channel. This development in the XRP price is noteworthy, especially since it has sliced through the 61.8% Fibonacci retracement level at $0.55.
Hence, it is of utmost importance that Ripple buyers manage to keep XRP above this barrier.
However, a breakdown of this level could trigger an 11% crash toward the 50% Fibonacci retracement level at $0.49, a stable demand barrier. If the sellers continue to run amok at this price zone, Ripple could be in for a steep correction.
A breakdown of the lower trend line at $0.49 will signal the start of a downtrend. In such a scenario, the remittances token could slide a total of 21% toward the MRI’s State Trend Support at $0.39.
To do so, sellers need to breach through a crucial demand barrier that stands at $0.43.
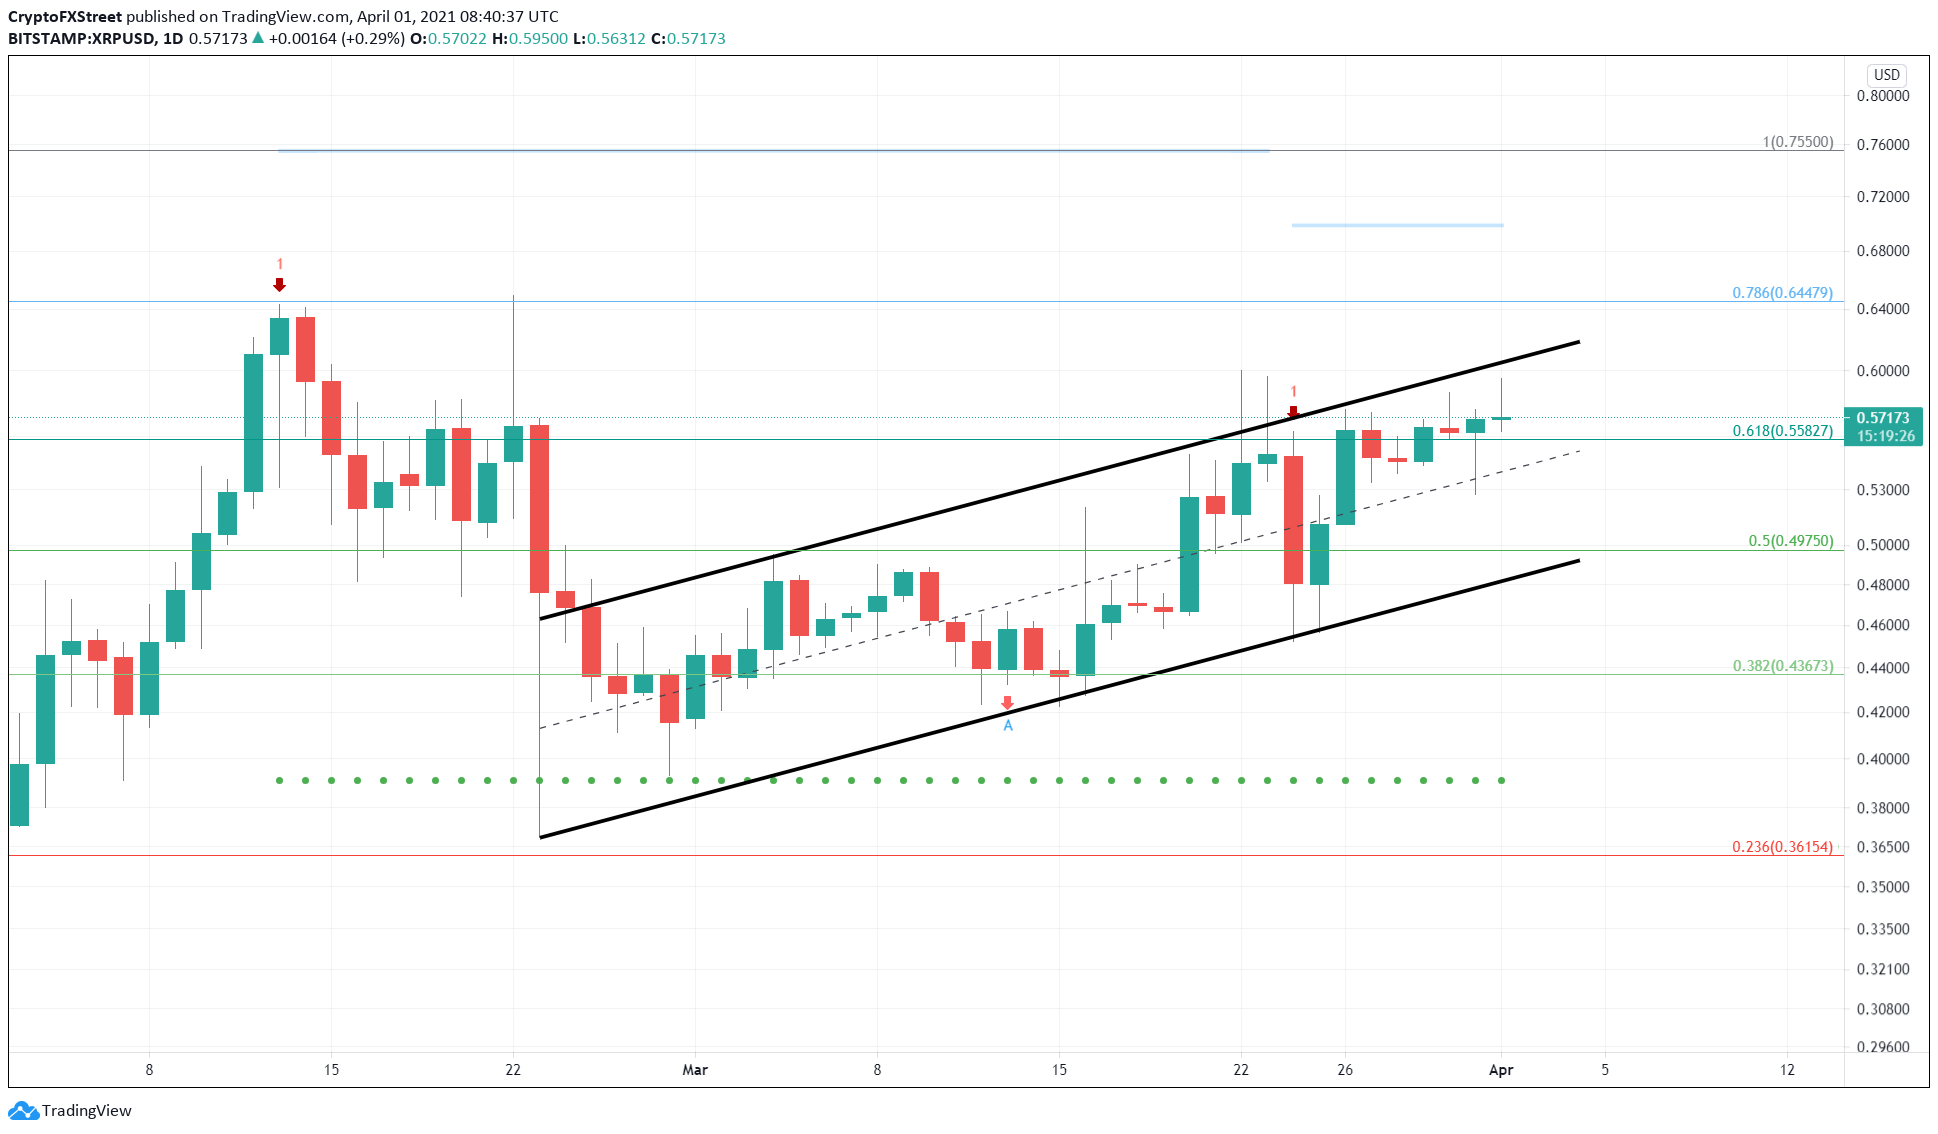
XRP/USD 1-day chart
On the flip side, if buyers manage to keep the XRP price above the 61.8% Fibonacci retracement level at $0.55, things could stay neutral or even turn bullish.
The bearish outlook might face extinction if Ripple pushes beyond the upper trend line at $0.61 in convincing fashion. If this were to happen, the XRP price could ascend 12% to $0.70, which coincides with the MRI’s breakout line.
Author

Akash Girimath
FXStreet
Akash Girimath is a Mechanical Engineer interested in the chaos of the financial markets. Trying to make sense of this convoluted yet fascinating space, he switched his engineering job to become a crypto reporter and analyst.


