Ethereum Price Analysis: ETH consolidation nears completion, targeting $2,500
- Ethereum price back above key short-term simple moving averages (SMA).
- 20% rally off the March 24 low puts the declining trend line in play.
- Daily volume lacking over the last six uptrend days.

Ethereum price has constructed a symmetrical triangle on the daily chart after briefly trading below the 2018 high at $1,419.96. The entire corrective process has been on below-average volume, showing a legion of committed traders and investors. This is a correction in time as much as price.
Ethereum price only 11% from the all-time high
ETH is considered a leading cryptocurrency, but it correlates closely with Bitcoin and will be swayed by the flagship digital currency’s gyrations. Nevertheless, the underlying price action for ETH is constructive, with just one energetic day away from testing the all-time high established on February 20 at $2,041.42.
Short-term resistance for the bullish narrative is now at $1,857.00. A break above the declining trendline of the symmetrical triangle will meet some resistance at the March 13 high at $1,944.00, but most traders will be focused on the $2,041.42 level.
All-time highs are generally a challenge, such as the January 2018 high, so market participants should anticipate some back-and-forth price action. Even if resistance does emerge, traders should be prepared to raise their profit targets to the 1.382 and 1.618 Fibonacci retracement levels at $2,327.41 and $2,504.09, a gain of 24-34% from the breakout price of $1,857.00. It would be near the 37% measured move of the symmetrical triangle at $2,559.00.
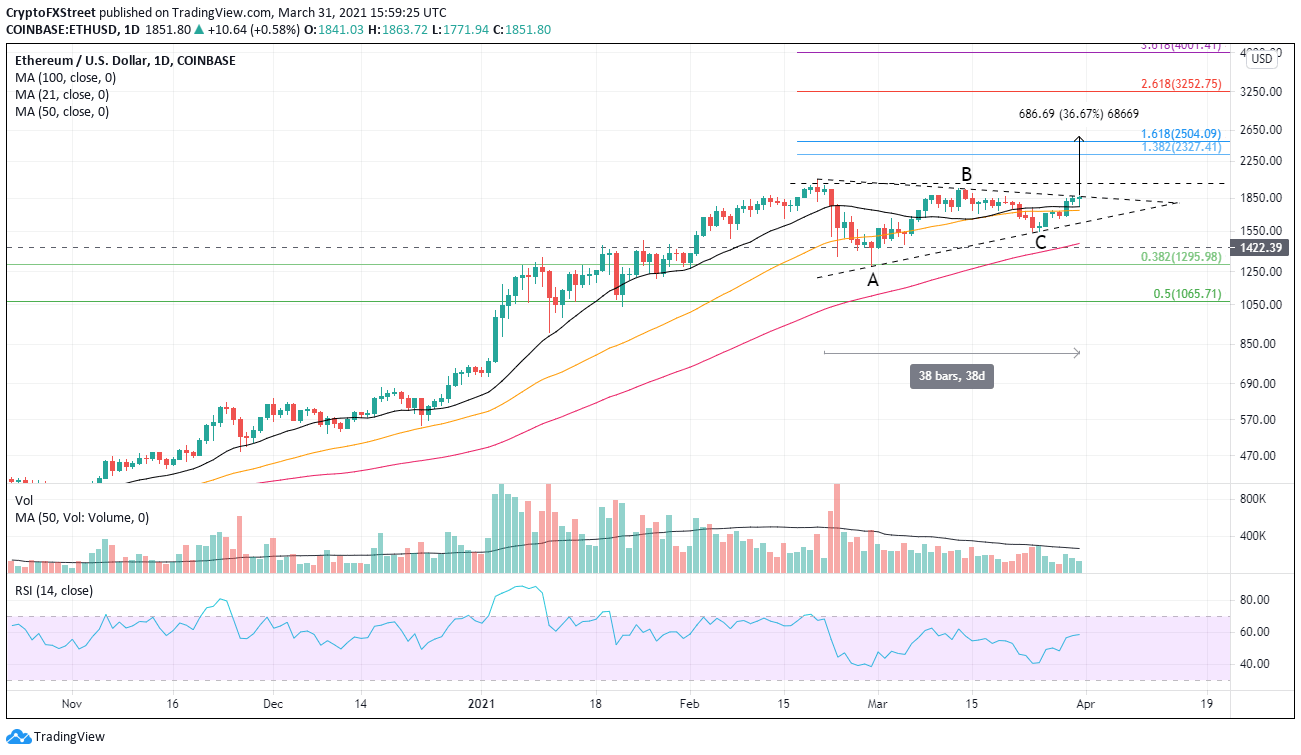
ETH/USD daily chart
Traders, like consumers, should be prepared for a few rotten apples. A failed breakout will put the 50-day SMA at $1,732.51 as the first support, followed by the ascending trendline of the triangle at $1,616, the March 24 low at $1,545.77, and finally, the confluence of the 100-day SMA with the 2018 high at $1,425.00.
Additional support springs to attention at the convergence of the 0.382 Fibonacci retracement level and the February low at $1,292.76-$1,295.98.
Author

Sheldon McIntyre, CMT
Independent Analyst
Sheldon has 24 years of investment experience holding various positions in companies based in the United States and Chile. His core competencies include BRIC and G-10 equity markets, swing and position trading and technical analysis.


