Ethereum price eyes 5% swing south as SEC delays Grayscale spot ETH ETF
- Ethereum price has dropped nearly 20% since the range high of $2,717 on January 12.
- ETH downtrend could bottom out after a 5% extension to a buyer congestion level.
- The bearish thesis will be invalidated if the PoS token breaks and closes above $2,388.
- BlackRock’s Spot Ether ETF application delay was deja vu as ETH holders remain hopeful like their BTC counterparts.

Ethereum (ETH) price has been rolling down a cliff since January 12 when news of Grayscale Bitcoin Trust (GBTC) redemptions broke. The slump has seen Ether fall out from below the confines of a bullish technical formation, but that could end soon as the spot ETH exchange-traded funds (ETFs) theme gathers momentum.
Also Read: Spot Ethereum ETF: SEC delays BlackRock application; ETH price stays dormant
SEC delays Grayscale spot ETH ETF application
After Bitcoin, an ETH ETF is next on investors’ radar, with Ark Invest COO Tom Staudt saying it will come “soon”. This is despite the delayed decision on Wednesday for BlackRock’s spot ETH ETF application, which preceded another delay of Grayscale’s ETH application, this time with an order to institute proceedings.
BREAKING: SEC DELAYS GRAYSCALE SPOT ETHEREUM ETF (CONVERSION) pic.twitter.com/6WZ4HVsIQG
— Mister Crypto (@misterrcrypto) January 25, 2024
Despite the delay, hope remains alive among ETH holders, crypto hobbyists and enthusiasts alike. This is because the spot BTC ETF investment product suffered a similar fate. As FXStreet reported, there were multiple delays for the eleven applicants and subsequent engagements between the filers and the financial regulator before the landmark approval on January 10.
Ethereum price eyes 5% swing south before possible bullish takeover as spot ETH ETF theme develops
Ethereum price is likely to extend the fall 5%, bringing total losses since the January 12 rejection to around 25%. If history is enough to go by, the $2,059 to $2,118 order block is likely to hold as support, providing ETH with an inflection point. A break and close below the midline of this order block at $2,088 would confirm the continuation of the downtrend.
The Relative Strength Index (RSI) is southbound, suggesting falling momentum, whereas the Moving Average Convergence Divergence (MACD) indicator is in negative territory while stuck below its signal line (orange band). This accentuates the bearish thesis.
Furthermore, the Average Directional Index (ADX) indicator, which quantifies trend strength, is inching north, a sign that the predominant trend still abounds.
If the aforementioned order block fails to hold, Ethereum price could slip past it to tag confluence between the 200-day SMA and the horizontal line at $1,935, below which the big-picture bullish outlook would be invalidated.
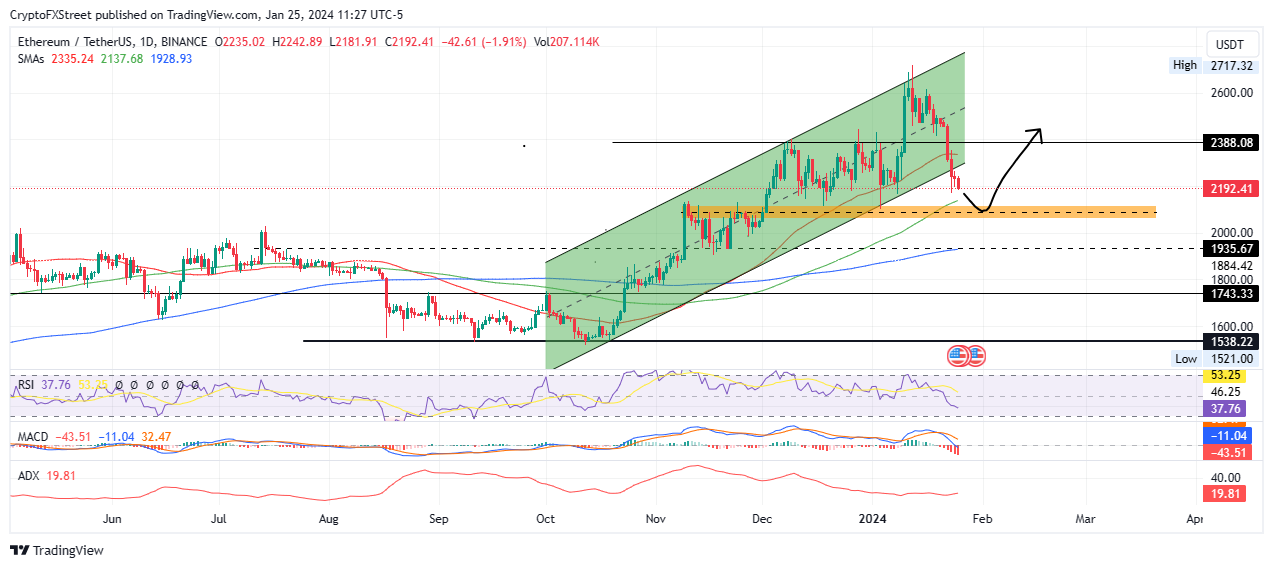
ETH/USDT 1-day chart
On the flipside, if the bulls enter the fray, Ethereum price could sidestep the anticipated 5% loss to push north and reclaim the support provided by the lower boundary of the channel. Increased buyer momentum above this level could see ETH shatter the 50-day SMA at $2,335, potentially extrapolating the gains above the $2,388 resistance, thereby invalidating the bearish thesis.
Above here, ETH could overcome the midline of the channel at $2,600 before Ethereum price clears the $2,717 resistance level as it reaches for the $3,000 psychological level, nearly 40% above current levels.
Author

Lockridge Okoth
FXStreet
Lockridge is a believer in the transformative power of crypto and the blockchain industry.


