- ETH/USD eases from all-time high amid overbought RSI.
- Sustained break of weekly resistance, bullish MACD hint further upside.
- 17-day-old rising trend channel also portrays bullish momentum.
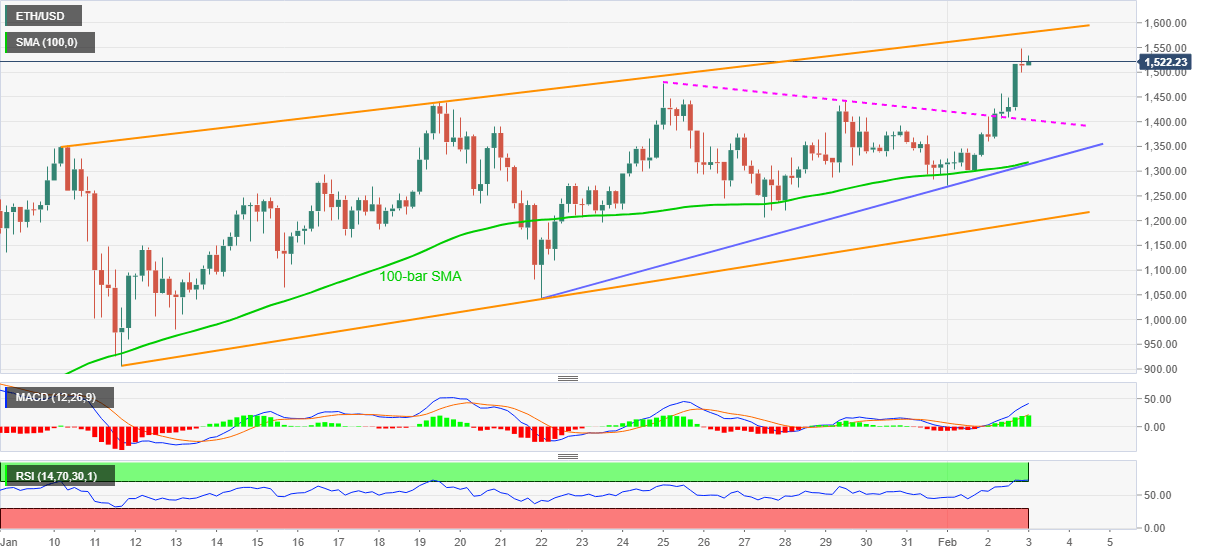
ETH/USD eases from the record top of $1,549 to $1,517.70 during early Wednesday. The altcoin buyers might have taken a break amid overbought RSI conditions but the bullish momentum, portrayed by MACD and successful break of short-term resistance, now support, keeps suggesting the quote’s further upside.
As a result, the top line of an upward sloping trend channel stretched from January 10, currently around $1,580, gains the ETH/USD buyers’ attention, for now.
However, any further upside will not hesitate to challenge the $2,000 psychological magnet wherein the $1,600 threshold can act as an intermediate stop.
Alternatively, a downside break of the previous resistance line from January 25, currently around $1,400, will be challenged by 100-bar SMA and an eight-day long ascending support line near $1,315.
If at all the ETH/USD sellers manage to break $1,315, the stated channel’s lower line close to $1,200 will be the key to watch.
ETH/USD four-hour chart
Trend: Bullish
Information on these pages contains forward-looking statements that involve risks and uncertainties. Markets and instruments profiled on this page are for informational purposes only and should not in any way come across as a recommendation to buy or sell in these assets. You should do your own thorough research before making any investment decisions. FXStreet does not in any way guarantee that this information is free from mistakes, errors, or material misstatements. It also does not guarantee that this information is of a timely nature. Investing in Open Markets involves a great deal of risk, including the loss of all or a portion of your investment, as well as emotional distress. All risks, losses and costs associated with investing, including total loss of principal, are your responsibility. The views and opinions expressed in this article are those of the authors and do not necessarily reflect the official policy or position of FXStreet nor its advertisers. The author will not be held responsible for information that is found at the end of links posted on this page.
If not otherwise explicitly mentioned in the body of the article, at the time of writing, the author has no position in any stock mentioned in this article and no business relationship with any company mentioned. The author has not received compensation for writing this article, other than from FXStreet.
FXStreet and the author do not provide personalized recommendations. The author makes no representations as to the accuracy, completeness, or suitability of this information. FXStreet and the author will not be liable for any errors, omissions or any losses, injuries or damages arising from this information and its display or use. Errors and omissions excepted.
The author and FXStreet are not registered investment advisors and nothing in this article is intended to be investment advice.
Recommended Content
Editors’ Picks
Watch out for Ethereum price as technical indicators point to dip below $1,000

Ethereum (ETH) price is revealing a not-that bright picture for bulls this week, both from a technical perspective and because of ballooning tail risks. As bulls could not manage a close above a crucial technical hurdle, price action slipped further to the downside and moved away from the essential historic barrier.
As NATO troops double, so do the bears' army in XRP

Ripple (XRP) price is returning with a hangover after a very short-lived party in which it rallied from $0.3043 to $0.3710, and booked 21% gains. Although bulls temporarily pushed the price above $0.3710, it turned out to be a false breakout, and eventually closed the day below, catching a lot of bulls in a bull trap in the process.
Why you should approach Bitcoin price with caution

A brief technical and on-chain analysis on Bitcoin price. Here, FXStreet's analysts evaluate where BTC could be heading next.
Why this move from Shiba Inu price could catch investors off guard?

Shiba Inu price prepares for a quick retracement after nearly a week of recovery bounce. While this run-up was impressive, things are likely going to go slow for SHIB as investors continue to book profits.
Bitcoin: Everything you need to know about BTC 200-week MA

Bitcoin price has gone through turbulent times over the last few months. From reaching a new all-time high to hitting yearly lows and revisiting levels since 2020, the crypto markets have been extremely volatile.