Top 3 Price Prediction Bitcoin, Ethereum, Ripple: BTC to test bulls conviction
- Bitcoin price is likely to retrace another 8% and tag the daily demand zone, extending from $36,398 to $38,895.
- Ethereum price seems to have found a support level at $2,823, suggesting a slowdown of the downtrend.
- Ripple price trades comfortably above the 50% retracement level at $0.731, possibly sliding lower.

Bitcoin price set up a higher high on the daily chart, and the current retracement is likely to confirm whether bulls are ready or not for a run-up. Ethereum and Ripple show different setups but ultimately will follow in the big crypto’s footsteps.
Bitcoin price to test bulls’ resilience
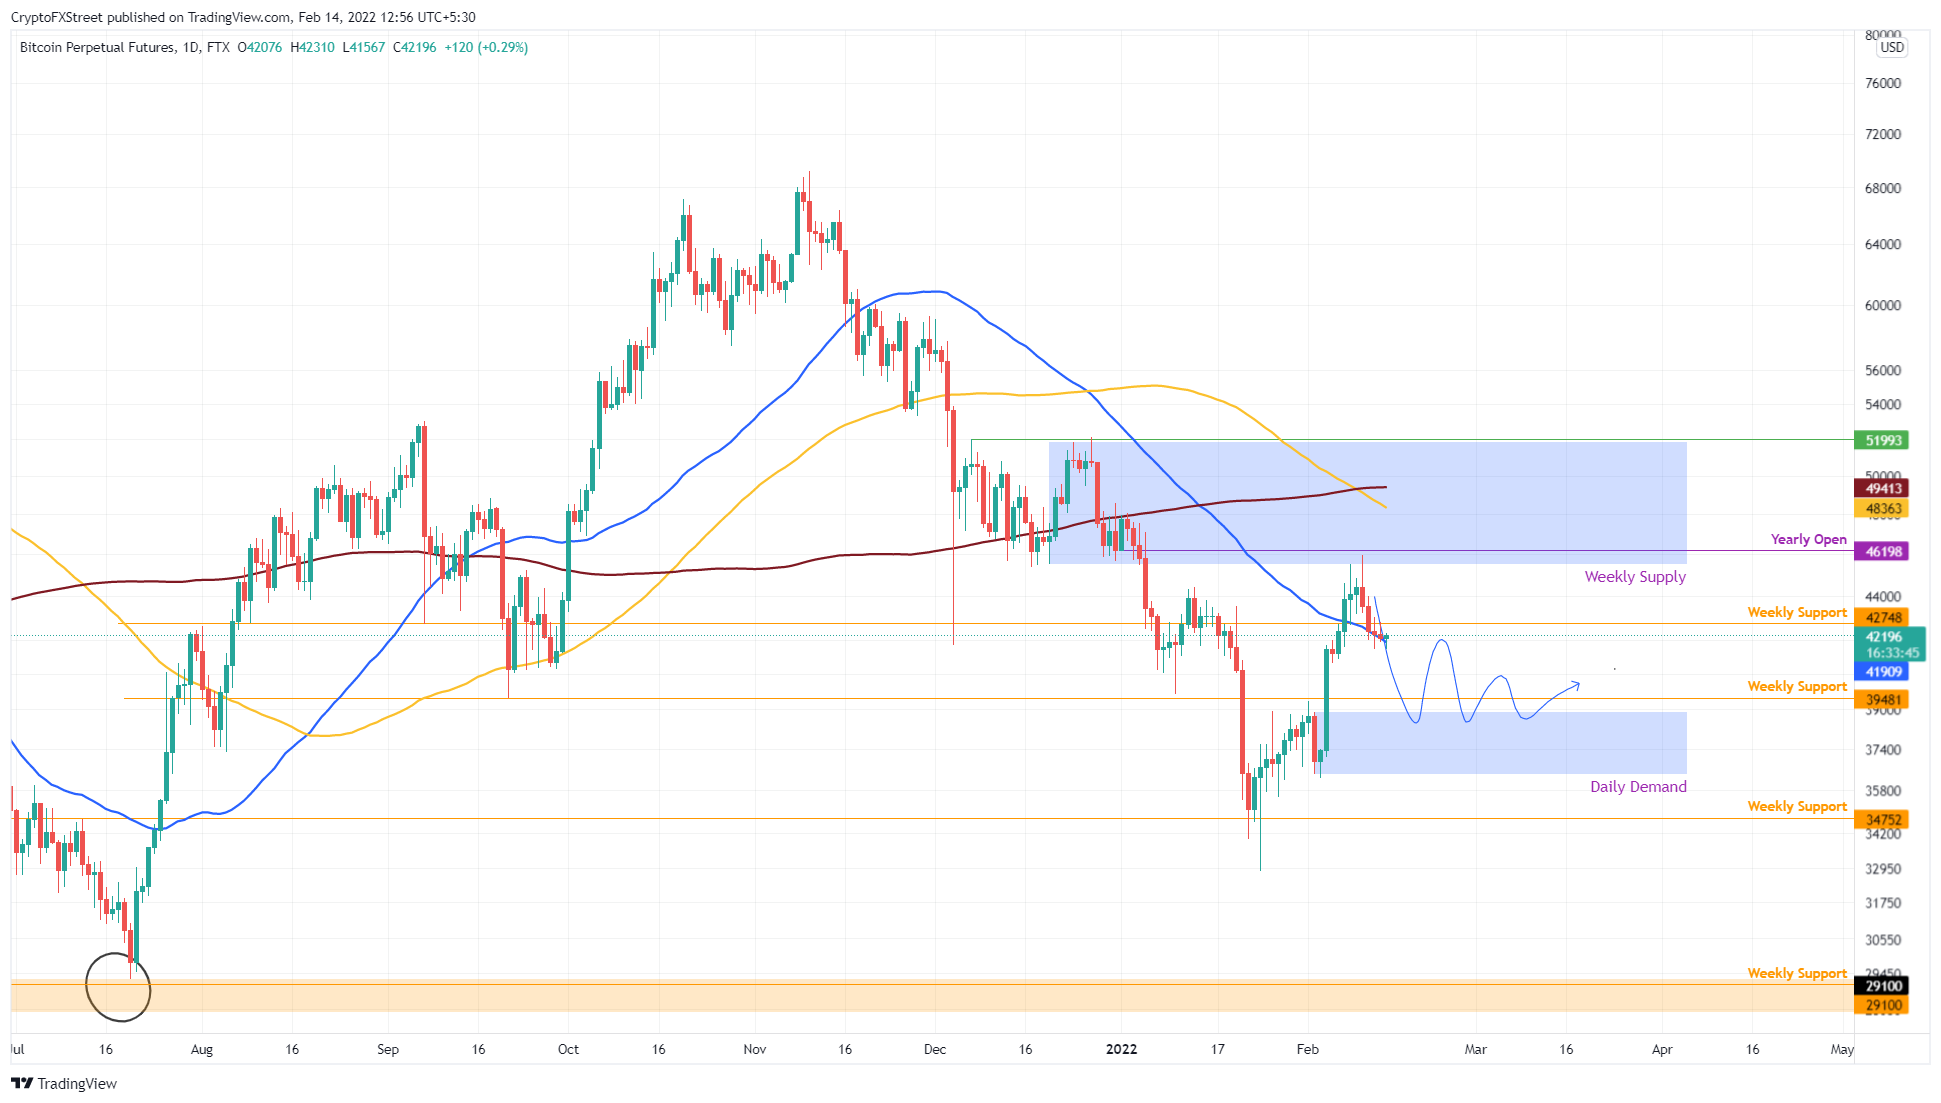
Bitcoin price sliced through its 50-day Simple Moving Average (SMA) on February 9, establishing a higher high at $45,956. This move exhausted the bullish momentum, however, and is currently undergoing retracement.
If the resulting downswing produces a higher low, it will set the scene for a bullish swing. The daily demand zone, stretching from $36,398 to $38,895, is where BTC is likely to set up a higher low, confirming a bullish outlook, and investors can expect the big crypto to see a reversal around this area.
BTC/USD 1-day chart
On the other hand, if Bitcoin price produces a daily candlestick close below $36,398, it will shatter the demand zone and see price make its way to the weekly support level at $34,752. A daily close below this level will invalidate the bullish thesis and trigger a potential correction all the way to $29,100.
Ethereum price finds a support level
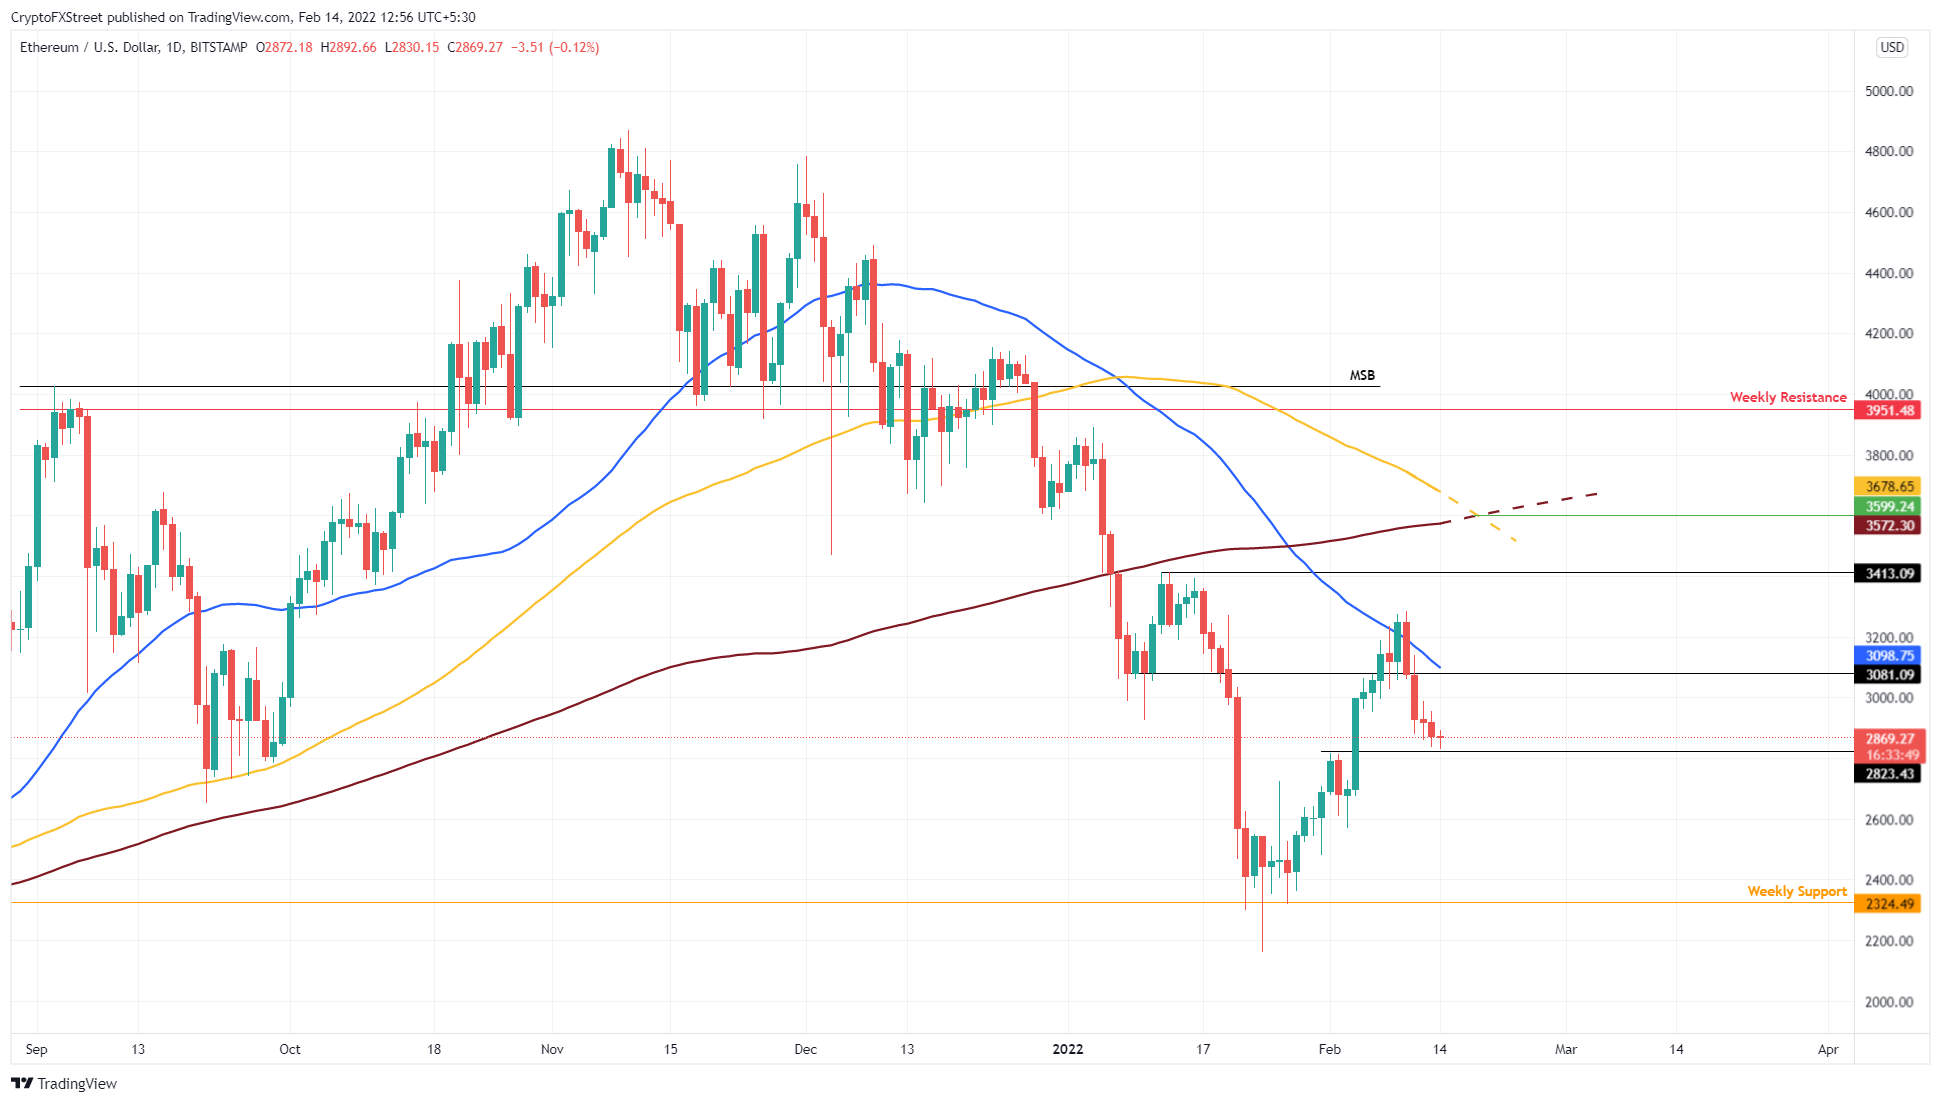
Ethereum price rallied 41% in two weeks and set up a lower high at $3,284 as it encountered the 50-day SMA. A 10% downswing followed rejection by the SMA, and saw ETH fall to where it currently trades - above the $2,823 support level.
Investors can expect ETH to sweep below this barrier before a directional bias is established. As long as the smart contract token stays above the weekly support level at $2,324, bulls can flourish.
ETH/USD 1-day chart
If Ethereum price produces a daily candlestick close below $2,324, it will create a lower low and suggest the continuation of the downtrend since November 10, 2021. In this case, ETH could revisit $1,730 and collect the liquidity resting below it.
Ripple price maintains its momentum
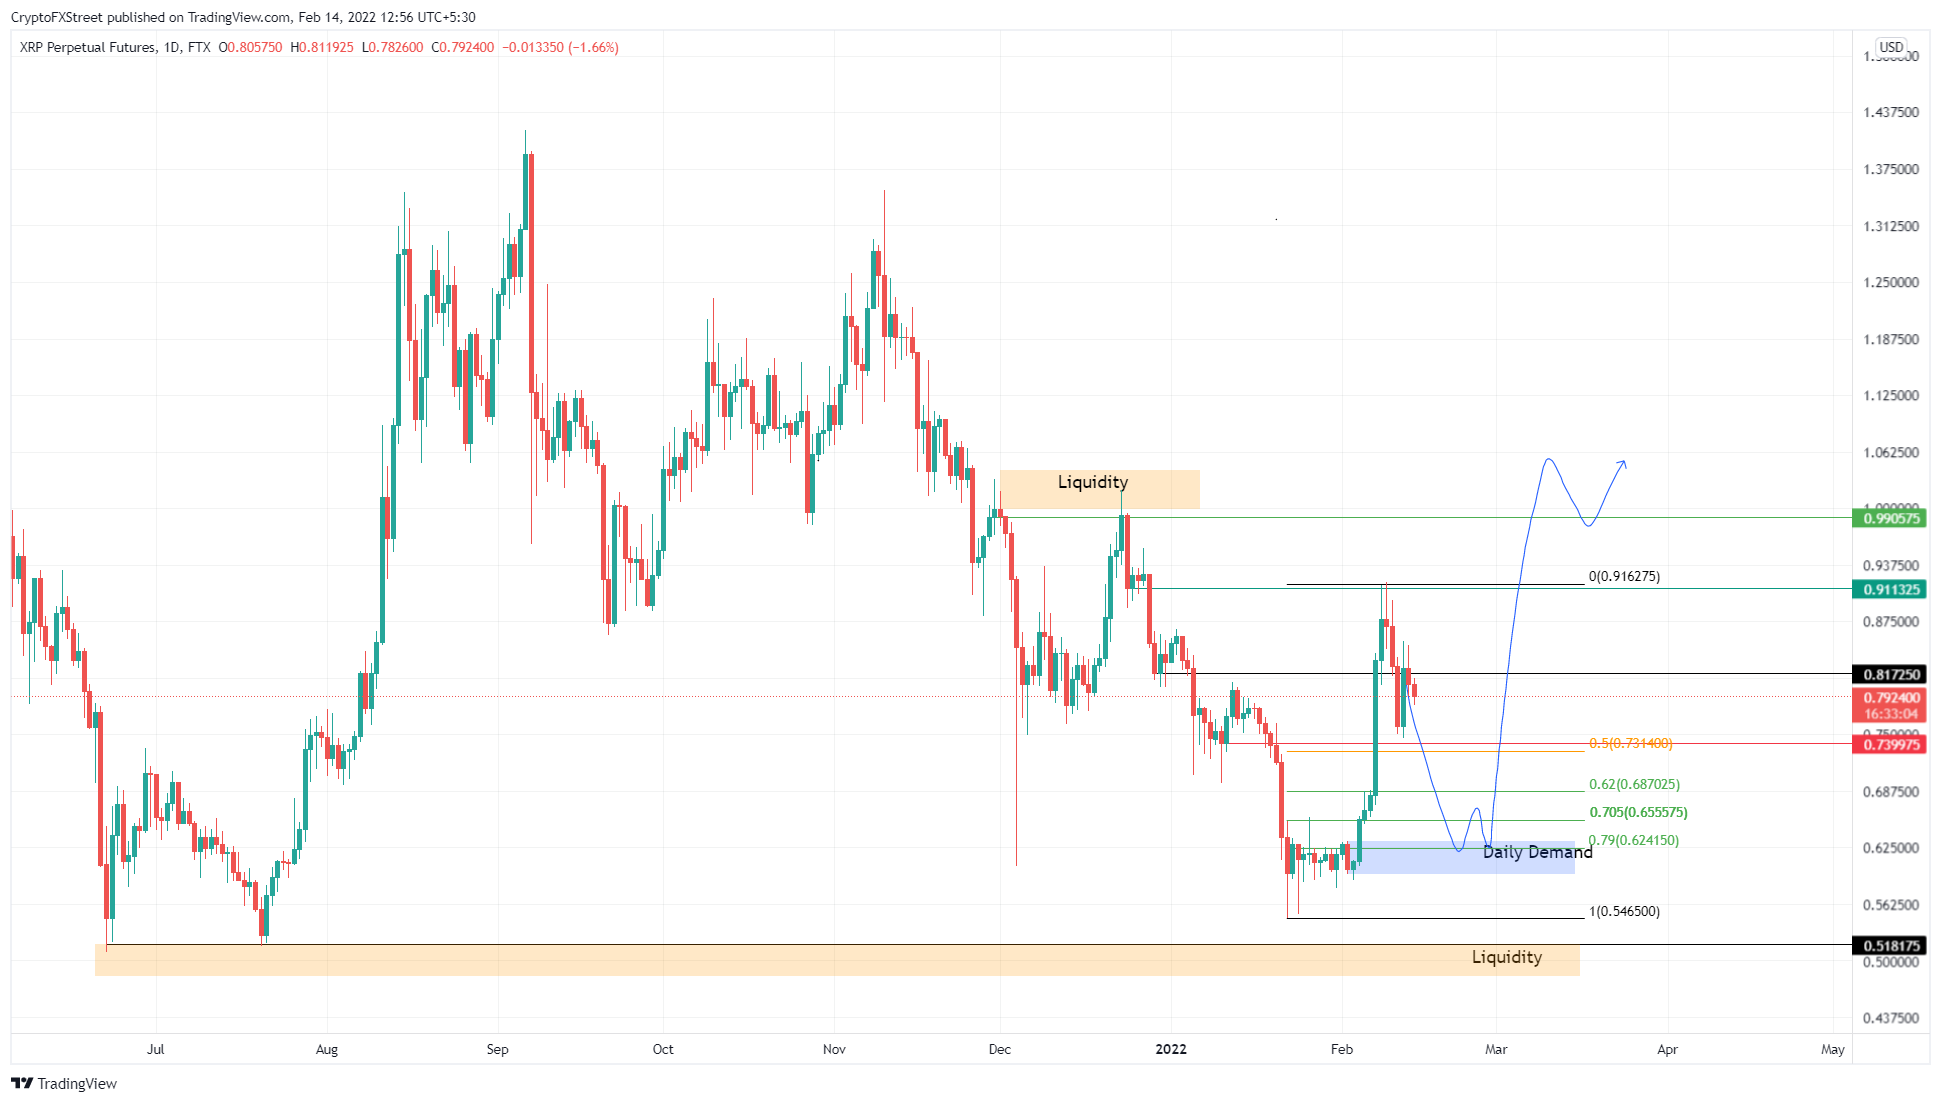
Ripple price exploded to $0.911 after it broke out of its two-week consolidation. This 55% ascent has since retraced by almost half, falling back to the 50% retracement level at $0.731 – but not quite, suggesting that buyers are still in control.
If Ripple price retraces lower, the daily demand zone, extending from $0.595 to $0.632, will absorb the incoming selling pressure. This will probably lead to a reversal, setting a higher low and indicating the start of an uptrend.
If the buying pressure continues to build up, XRP price will revisit the $1 psychological level and collect the buy-stop liquidity resting above it.
XRP/USD 1-day chart
A daily candlestick close below $0.546 will create a lower low, invalidating the bullish thesis. In this case, Ripple price will tag the $0.518 support level and collect the sell-side liquidity below it.
Author

Akash Girimath
FXStreet
Akash Girimath is a Mechanical Engineer interested in the chaos of the financial markets. Trying to make sense of this convoluted yet fascinating space, he switched his engineering job to become a crypto reporter and analyst.



