Ethereum hits critical support level before ETH resumes march to $4,000
- Ethereum price is likely to continue its upward trend despite Russia and Ukraine concerns.
- The recent pullback was normal and natural.
- $2,900 value area now in focus.

Ethereum price action is positioned to pull the rug on all short-sellers and buyers who have been scared to enter. The technical conditions on the price chart and the oscillators show Ethereum has developed one of the most substantial collections of bullish setups in many months.
Ethereum price to shock and awe
Ethereum price has several critical technical levels and patterns to watch. The first is the inverse head-and-shoulders pattern currently in development. The current right shoulder (if it remains at the present level) at $2,900 is a strong support zone with the 50% Fibonacci retracement and daily Tenkan-Sen sharing that shoulder.
The oscillators validate the $2,900 level as the current swing is low due to hidden bullish divergence. Hidden bullish divergence occurs when the candlestick chart displays higher lows, but an oscillator prints lower lows. It is a warning sign that the current pullback is likely to end, and Ethereum price will resume its uptrend. That the divergence appears as Ethereum hits the most vital near-term support zone exacerbates the likelihood of Ethereum finding a bottom at $2,900.
If Ethereum price does resume its uptrend, then the next price resistance zone ahead is the confluence zone at $3,300, where the 38.2% Fibonacci retracement and head-and-shoulders neckline intersect. However, the resistance continues at $3,400 due to the bottom of the Ichimoku Cloud (Senkou Span A) and the bottom of a former bull flag in that price range. If bulls can close ETH above that, the road to $4,000 is all but a forgone conclusion.
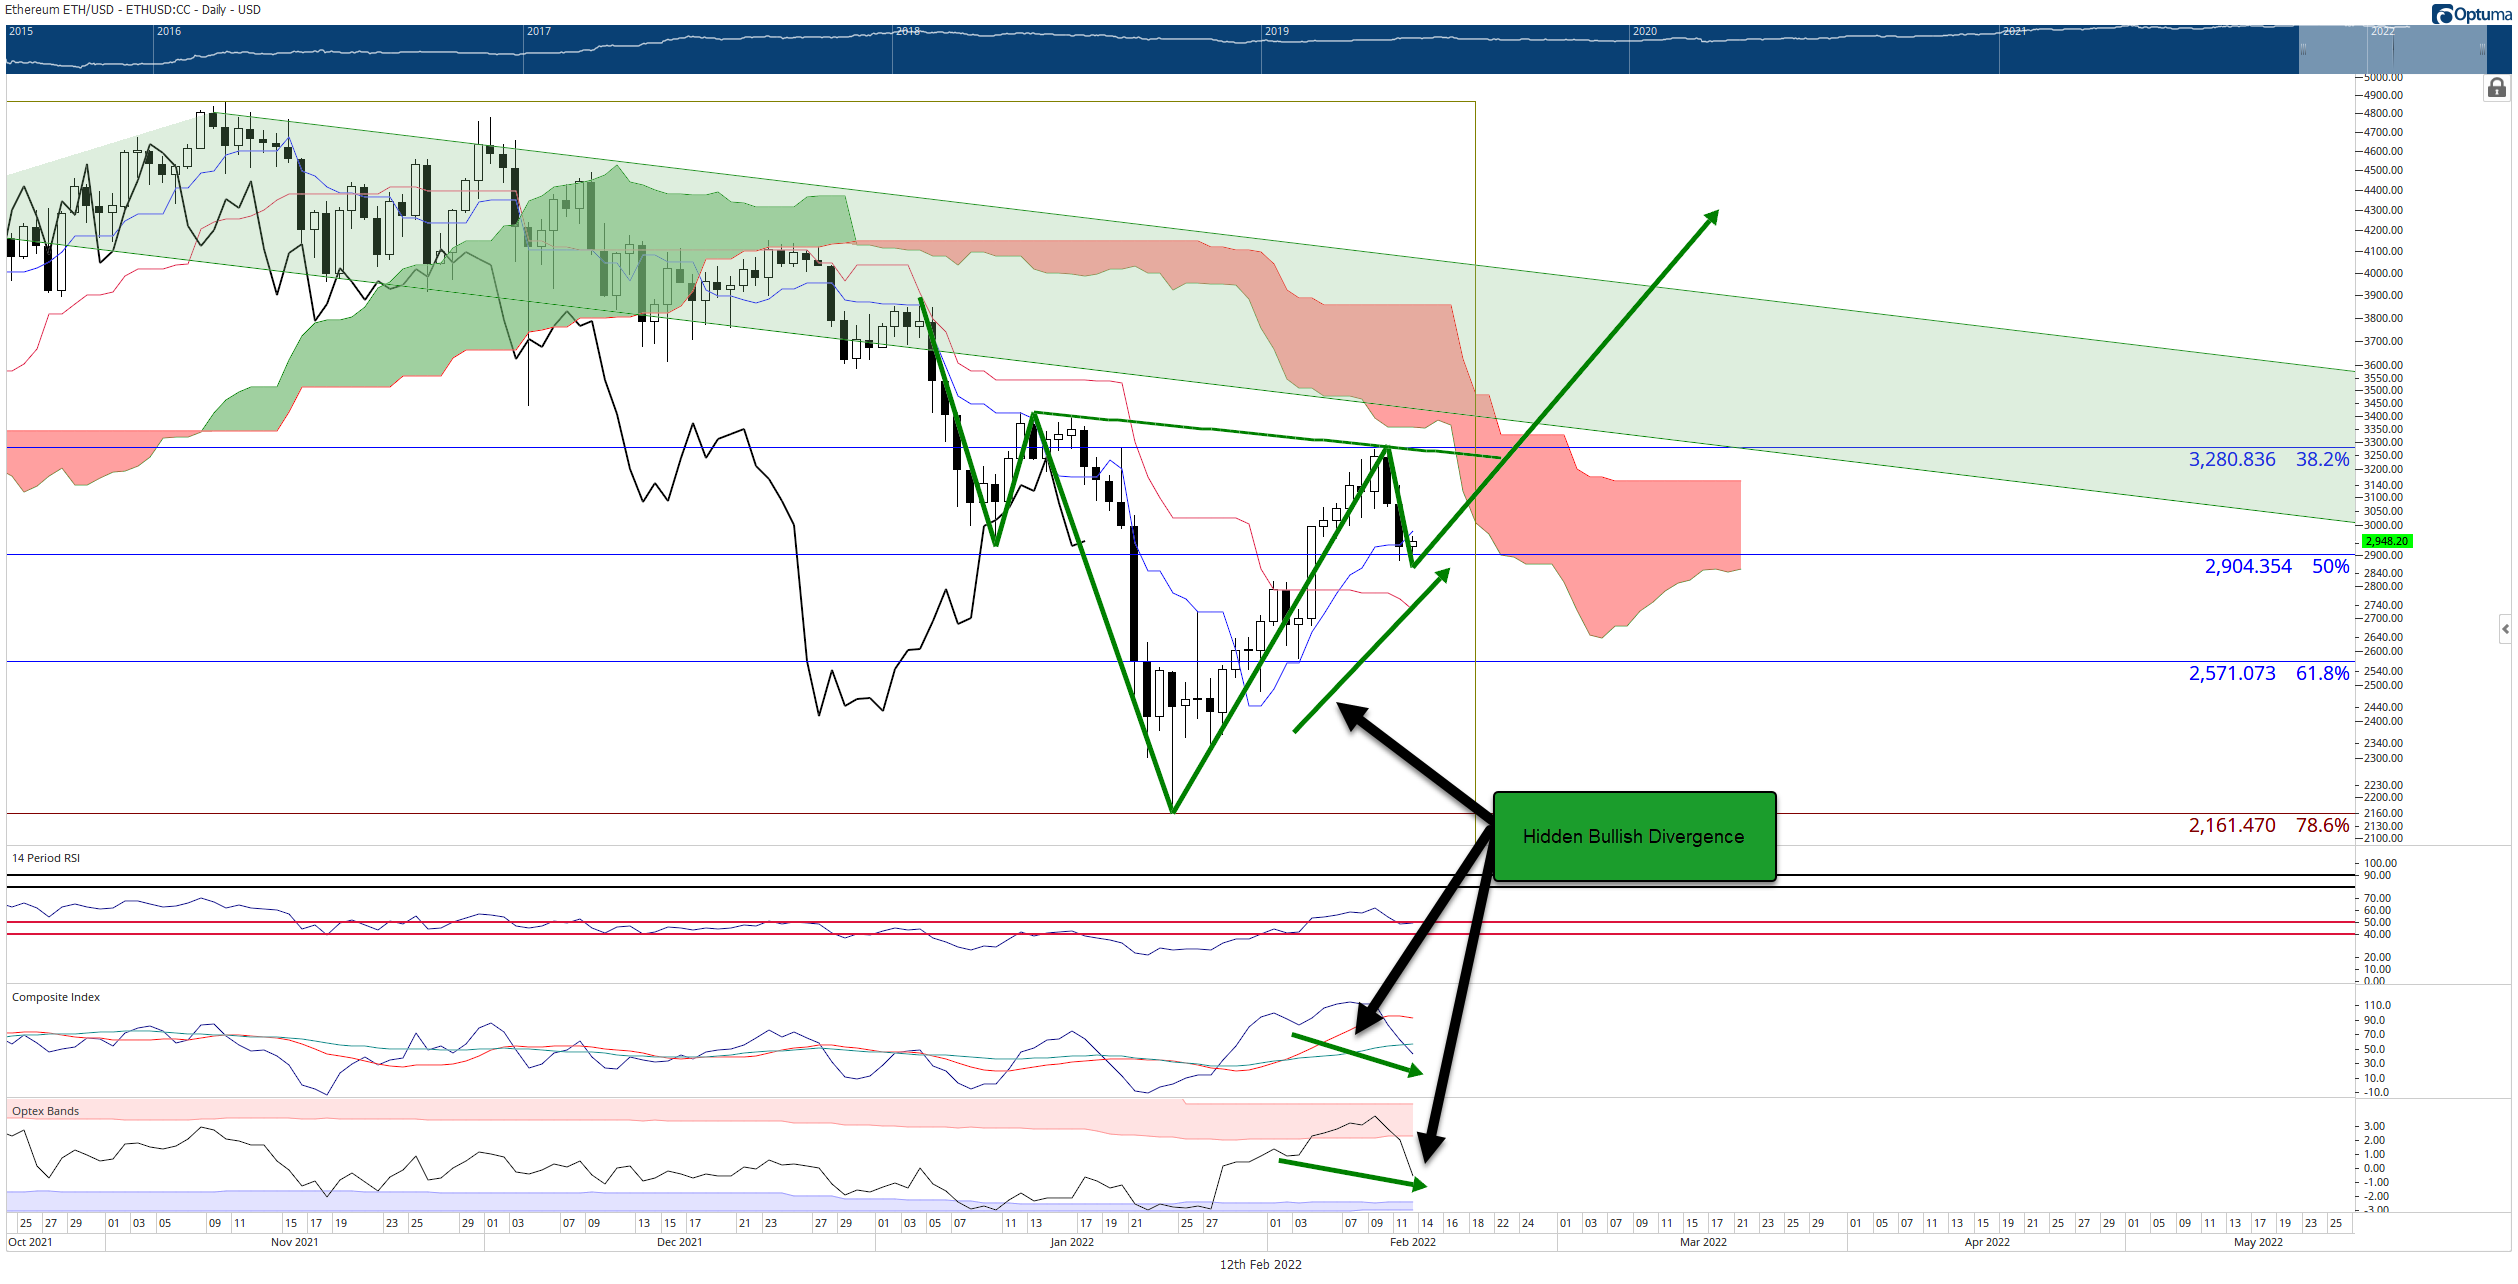
ETH/USD Daily Ichimoku Kinko Hyo Chart
Downside risks do remain. If $2,900 fails, there is one final support structure within the Ichimoku system that can prevent a collapse in Ethereum price, and that is the Kijun-Sen at $2,700. If there is a daily close below the Kijun-Sen, a return to the 2022 lows near $2,100 is highly probable.
Author

Jonathan Morgan
Independent Analyst
Jonathan has been working as an Independent future, forex, and cryptocurrency trader and analyst for 8 years. He also has been writing for the past 5 years.


