Ethereum is more of a currency than Bitcoin, says Jim Cramer, as ETH price attempts to kick-start new uptrend
- Ethereum price looks to establish first substantial higher high since all-time high on May 12.
- Mad Money host Jim Cramer said he is investing in Ethereum after selling nearly all of his BTC holdings.
- A breakdown of the $1,965 support level will invalidate the bullish thesis and delay the start of a new uptrend.

Etheruem price is trying to find a foothold to kick-start a massive bull rally after weeks of downswings. If the buyers manage to push ETH to set up a new swing high, it will signal the start of a bull rally that could take Ethereum price to levels last seen in mid-June.
Jim Cramer’s take on ETH, BTC
Ethereum is now the go-to crypto investment asset for Mad Money’s host Jim Cramer. The host reportedly sold nearly all of his BTC holdings due to China’s recent crackdown on Bitcoin mining.
To fill this void, the CNBC host said that he is looking to invest in the smart contract token, ETH.
He explains his preference by saying that,
I like Ethereum because people actually use it much more to be able to buy things.
He further argues that, unlike ETH, BTC struggles with defining its utility, be it a store of value or a currency. He added that the NFT markets taking off during the recent bull run helps Ethereum’s case.
The debate between the top two cryptocurrencies has been ongoing for some time. While Satoshi Nakamoto explained how Bitcoin could be money, the scalability issues have kept it from becoming one.
However, Ethereum has taken a completely different route than the pioneer crypto and has more utility. Despite numerous comparisons, both cryptocurrencies have evolved into much more than they were intended to be over the years.
Ethereum price looks to find a foothold
Ethereum price has not seen a substantial higher high since its all-time high at $4,372 on May 12. The downtrend exacerbated on May 19 and June 21, setting up new lows.
However, as the markets scramble to recover the losses, Ethereum price has come close to tagging the June 21 peak at $2,280. A decisive 4-hour candlestick close above this level would set up the first higher high since May 12, signaling the start of a new uptrend.
If this move were to occur, it would signal to sidelined investors to jump on the bandwagon, further amplifying the buying pressure and catapulting ETH higher.
While this optimistic scenario is inevitable, it might occur after the smart contract token finds a stable support level to bounce off of.
Therefore, investors can expect ETH to pull back to $2,045 or $1,965.
A swing high above $2,280 after a minor correction will confirm the start of a new uptrend, pushing ETH to slice through the 50% Fibonacci retracement level at $2,318 and subsequent resistance barriers at $2,552 and, in a highly bullish case, $2,640.
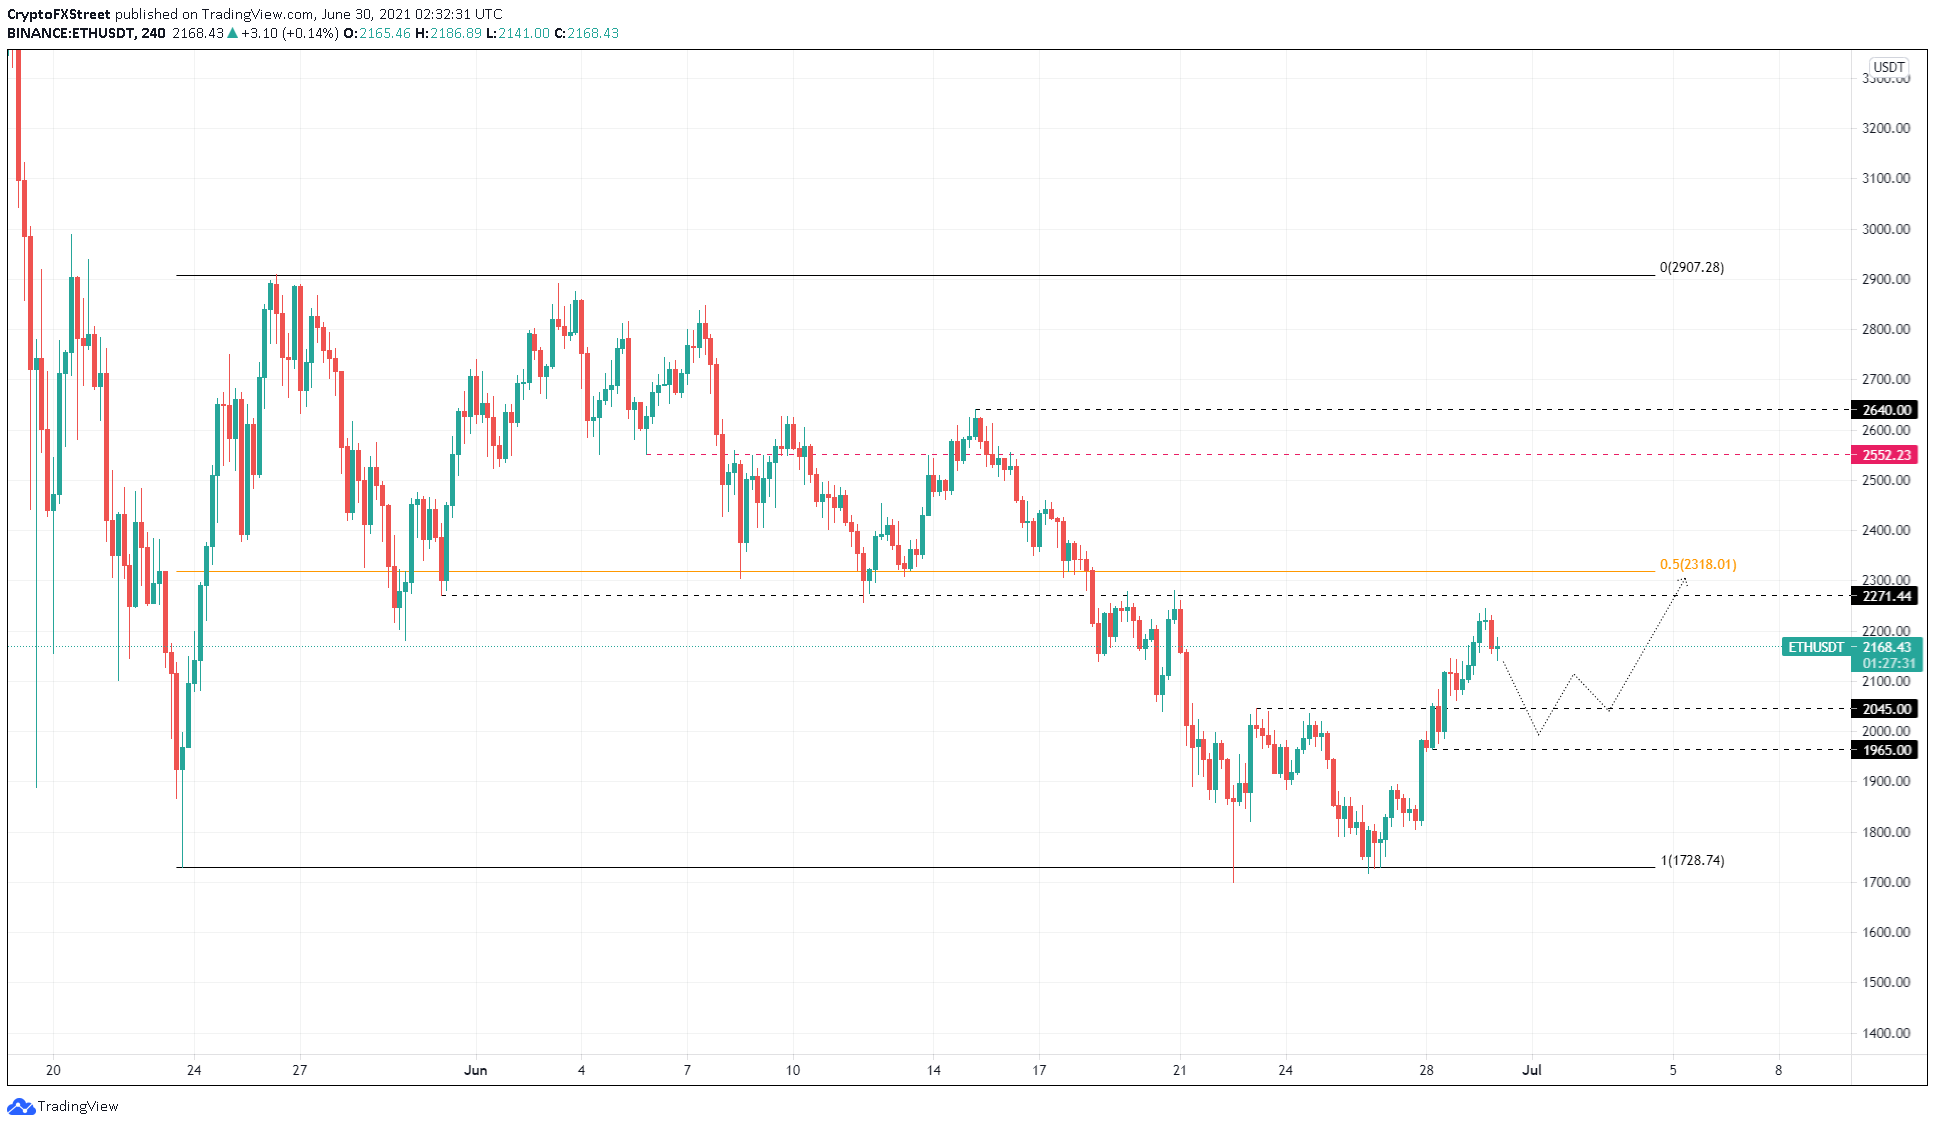
ETH/USDT 4-hour chart
However, if the support level at $2,045 is breached, it will push ETH down to $1,965. A sweep below $1,965 does not immediately threaten the upswing as long as the price manages to climb above it.
On the other hand, if Ethereum price gets rejected at $1,965, it will invalidate the bullish thesis. In such a case, the smart contract token might retest the range low at $1,728.
Author

Akash Girimath
FXStreet
Akash Girimath is a Mechanical Engineer interested in the chaos of the financial markets. Trying to make sense of this convoluted yet fascinating space, he switched his engineering job to become a crypto reporter and analyst.


