Dogecoin's recent network activity spike might not trigger DOGE price do the same, here's why
- Dogecoin price continues to trade between the $0.0749 to $0.0943 range for roughly a month.
- The BBW indicator indicator is in a squeeze position, hinting at a volatile move ahead for DOGE.
- If history repeats, there might be a sweep of the equal lows before the meme coin rallies 10% to the upside.
- Invalidation of the bullish outlook will occur if DOGE flips the $0.0749 support barrier into a resistance level.
Dogecoin (DOGE) price has been producing lower highs coupled with nearly equal lows hinting at a potential bottom formation. This development could be followed by a quick move to the upside, but not for the recent spike in network activity.
According to data from Santiment, the 24-hour Active Addresses for DOGE rose from roughly 141,000 on January 27 to 635,000 on February 3.
 [09.40.02, 04 Feb, 2024]-638426171115650123.png)
DOGE 24-hour Active Addresses
This 350% spike in network growth could generally be considered bullish, but in this case, it is not. The reasoning for this is simple: the hype generated around DOGE is due to three reasons:
- Inscriptions: The DRC-20 standard has been gaining popularity on multiple blockchains after a resounding success on the Bitcoin blockchain. This is one of the major reasons why the network activity has gone parabolic.
- As a result of the DRC-20 standard, a developer has integrated the classic first-person shooter game called DOOM on the Dogecoin blockchain.
- Rumors of DOGE being used as a payment rail for X.com formerly Twitter.
Also read: Dogecoin price sees minor gains despite uptick in network demand
Dogecoin price ready breakout
Dogecoin price created the $0.0749 to $0.0943 range in early January and has been trading inside it since then. DOGE has prominently traded below the range’s midpoint, indicating that the sellers are in control.
However, the formation of nearly equal lows indicates that the interested parties are buying the dips.
The Bollinger Bands Width (BBW) has flashed a squeeze signal, marked in green, which represents a period of low volatility for the underlying asset. Often, these squeeze periods are followed by volatile breakouts.
For instance, the squeeze signal indicated on January 17 and 18 was followed by a 6.65% move to the downside that swept the sell-side liquidity. This move was instantly proceeded by a 21% move to the upside and local top formation at $0.0905.
Dogecoin price currently trades at $0.0789, just below equal lows formed at $0.0771. Hence, if history repeats or even rhymes, investors can expect a sweep of $0.0771, followed by a quick 10% recovery rally that retests the range midpoint at $0.0846.
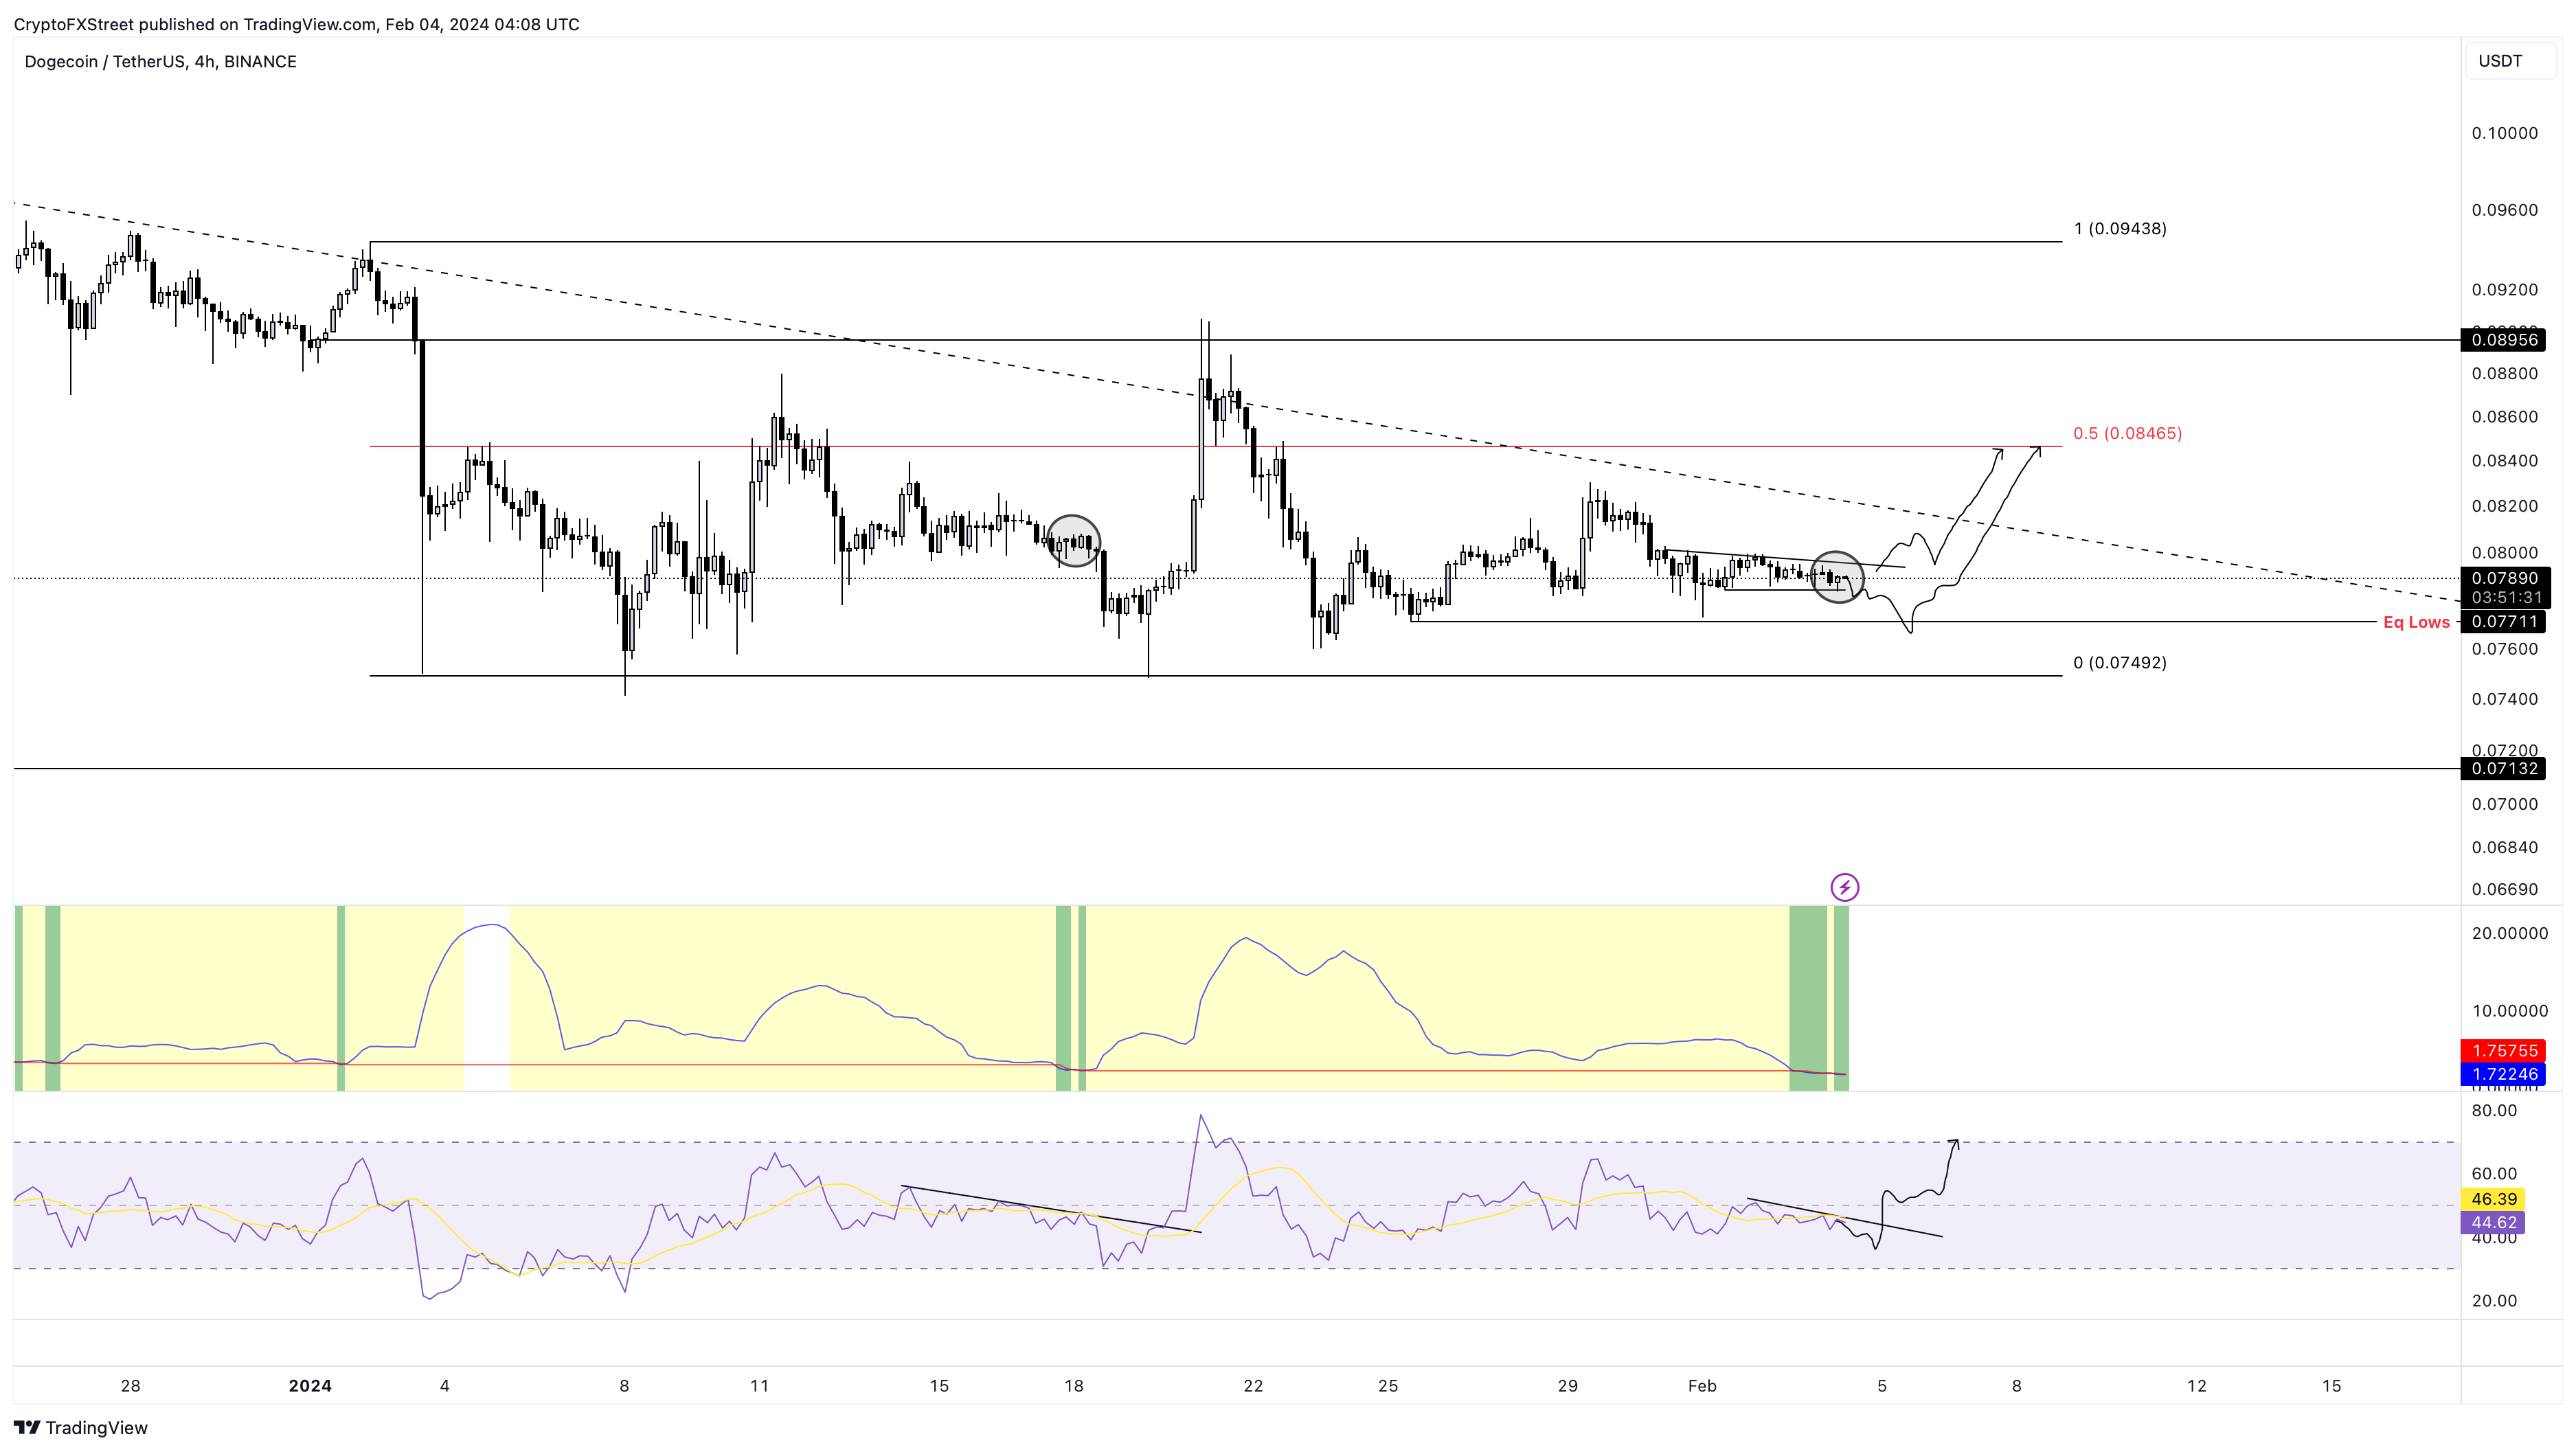
DOGE/USDT 4-hour chart
On the contrary, Bitcoin price looks ready for a quick move to the downside. If this outlook plays out for BTC, Dogecoin price could not only sweep the equal lows at $0.0771, but also the range low at $0.0749.
If the selling pressure is high and causes Dogecoin price to produce a four-hour candlestick close below $0.0749, it will invalidate the bullish thesis. In such a case, DOGE could drop nearly 5% and tag the next key support level at $0.0713.
Also read: Top three altcoins trending in crypto social media: Ethereum, Dogecoin, Ondo
Author

Akash Girimath
FXStreet
Akash Girimath is a Mechanical Engineer interested in the chaos of the financial markets. Trying to make sense of this convoluted yet fascinating space, he switched his engineering job to become a crypto reporter and analyst.