Dogecoin price sees minor gains despite uptick in network demand

- Dogecoin price has risen by a mere 2% in the past seven days.
- The price increase falls short of the significant uptick in network activity seen in the same period.
- Technical indicators showed that the coin’s subdued price action is due to downward bullish momentum.
Dogecoin (DOGE) price has registered a minor gain of 2% in the last week despite the growth in user activity on its network during the same period. The number of both new addresses and active addresses in transactions involving the meme coin has rallied, but its price continues to endure poor bullish sentiment.
Also read: Dogecoin Active Addresses surge nearly 12% overnight, to DOGE all-time high
Activity spikes on the Dogecoin network
Data from IntoTheBlock showed that new demand on the meme coin network has spiked in the last seven days, with the creation of 890,000 new addresses during that period. This marked a 134% uptick in the number of new addresses created to trade DOGE in the last week.
As new demand for the coin climbs, the daily count of addresses involved in DOGE transactions has also increased. In the past seven days, this has risen by 91%.
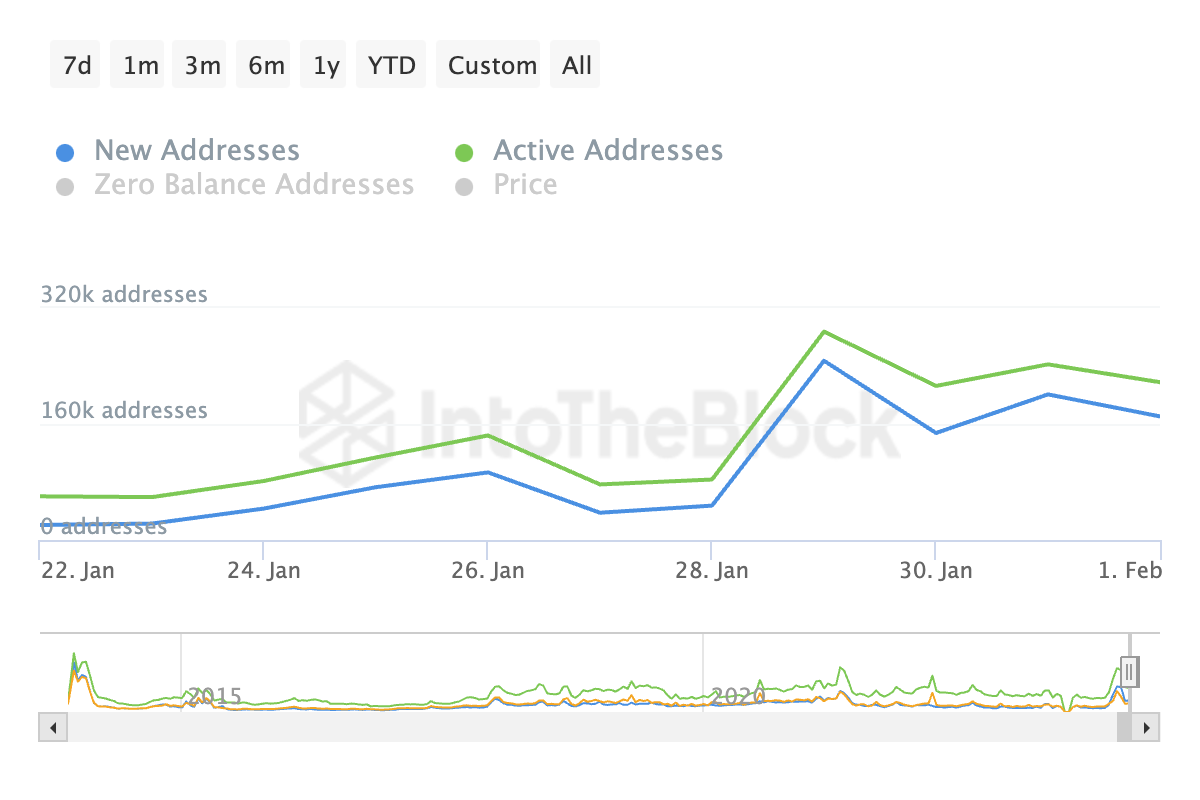
Dogecoin New Address and Daily Active Address. Source: IntoTheBlock
According to IntoTheBlock, the increase in the number of DOGE’s new addresses has resulted in a corresponding rally in the meme coin’s new adoption rate. This metric tracks the daily percentage of new addresses making their first transaction out of all active addresses. It offers valuable insights into the share that newcomers make out of total activity.
DOGE’s new adoption rate has trended upward in the last week. It was 78.33% at press time, witnessing a 24 percentage points jump in the past seven days.
DOGE bulls have a different plan
Despite the uptick in user activity, DOGE's low price reaction in the last week might be due to the poor demand that continues to trail the altcoin.
An assessment of the meme coin’s Awesome Oscillator (AO) on the daily chart shows that the indicator had posted downward-facing green bars in the last week.
When an asset’s AO indicator shows downward-facing green bars, it suggests weak bullish momentum. It means that while the asset’s price may be rising, the momentum is low and continues to diminish.
This seems to have played out with DOGE as its price rose by a mere 2% despite the significant surge in network activity on the chain. The meme coin currently trades at $0.079, logging a 13% price fall in the last month.
While the coin’s Moving Average Convergence Divergence (MACD) line rested above its trend line, both lines remained below zero, confirming the thesis that bullish momentum remained low despite increased activity on the Dogecoin network.
An assessment of the coin’s Parabolic SAR (Stop and Reverse) indicator showed the lines that make up the indicator were above the coin’s price at press time.
This indicator is used to identify trend direction and reversals. When it is positioned above an asset’s price, many traders interpret it as the right time to exit long positions or initiate short positions.
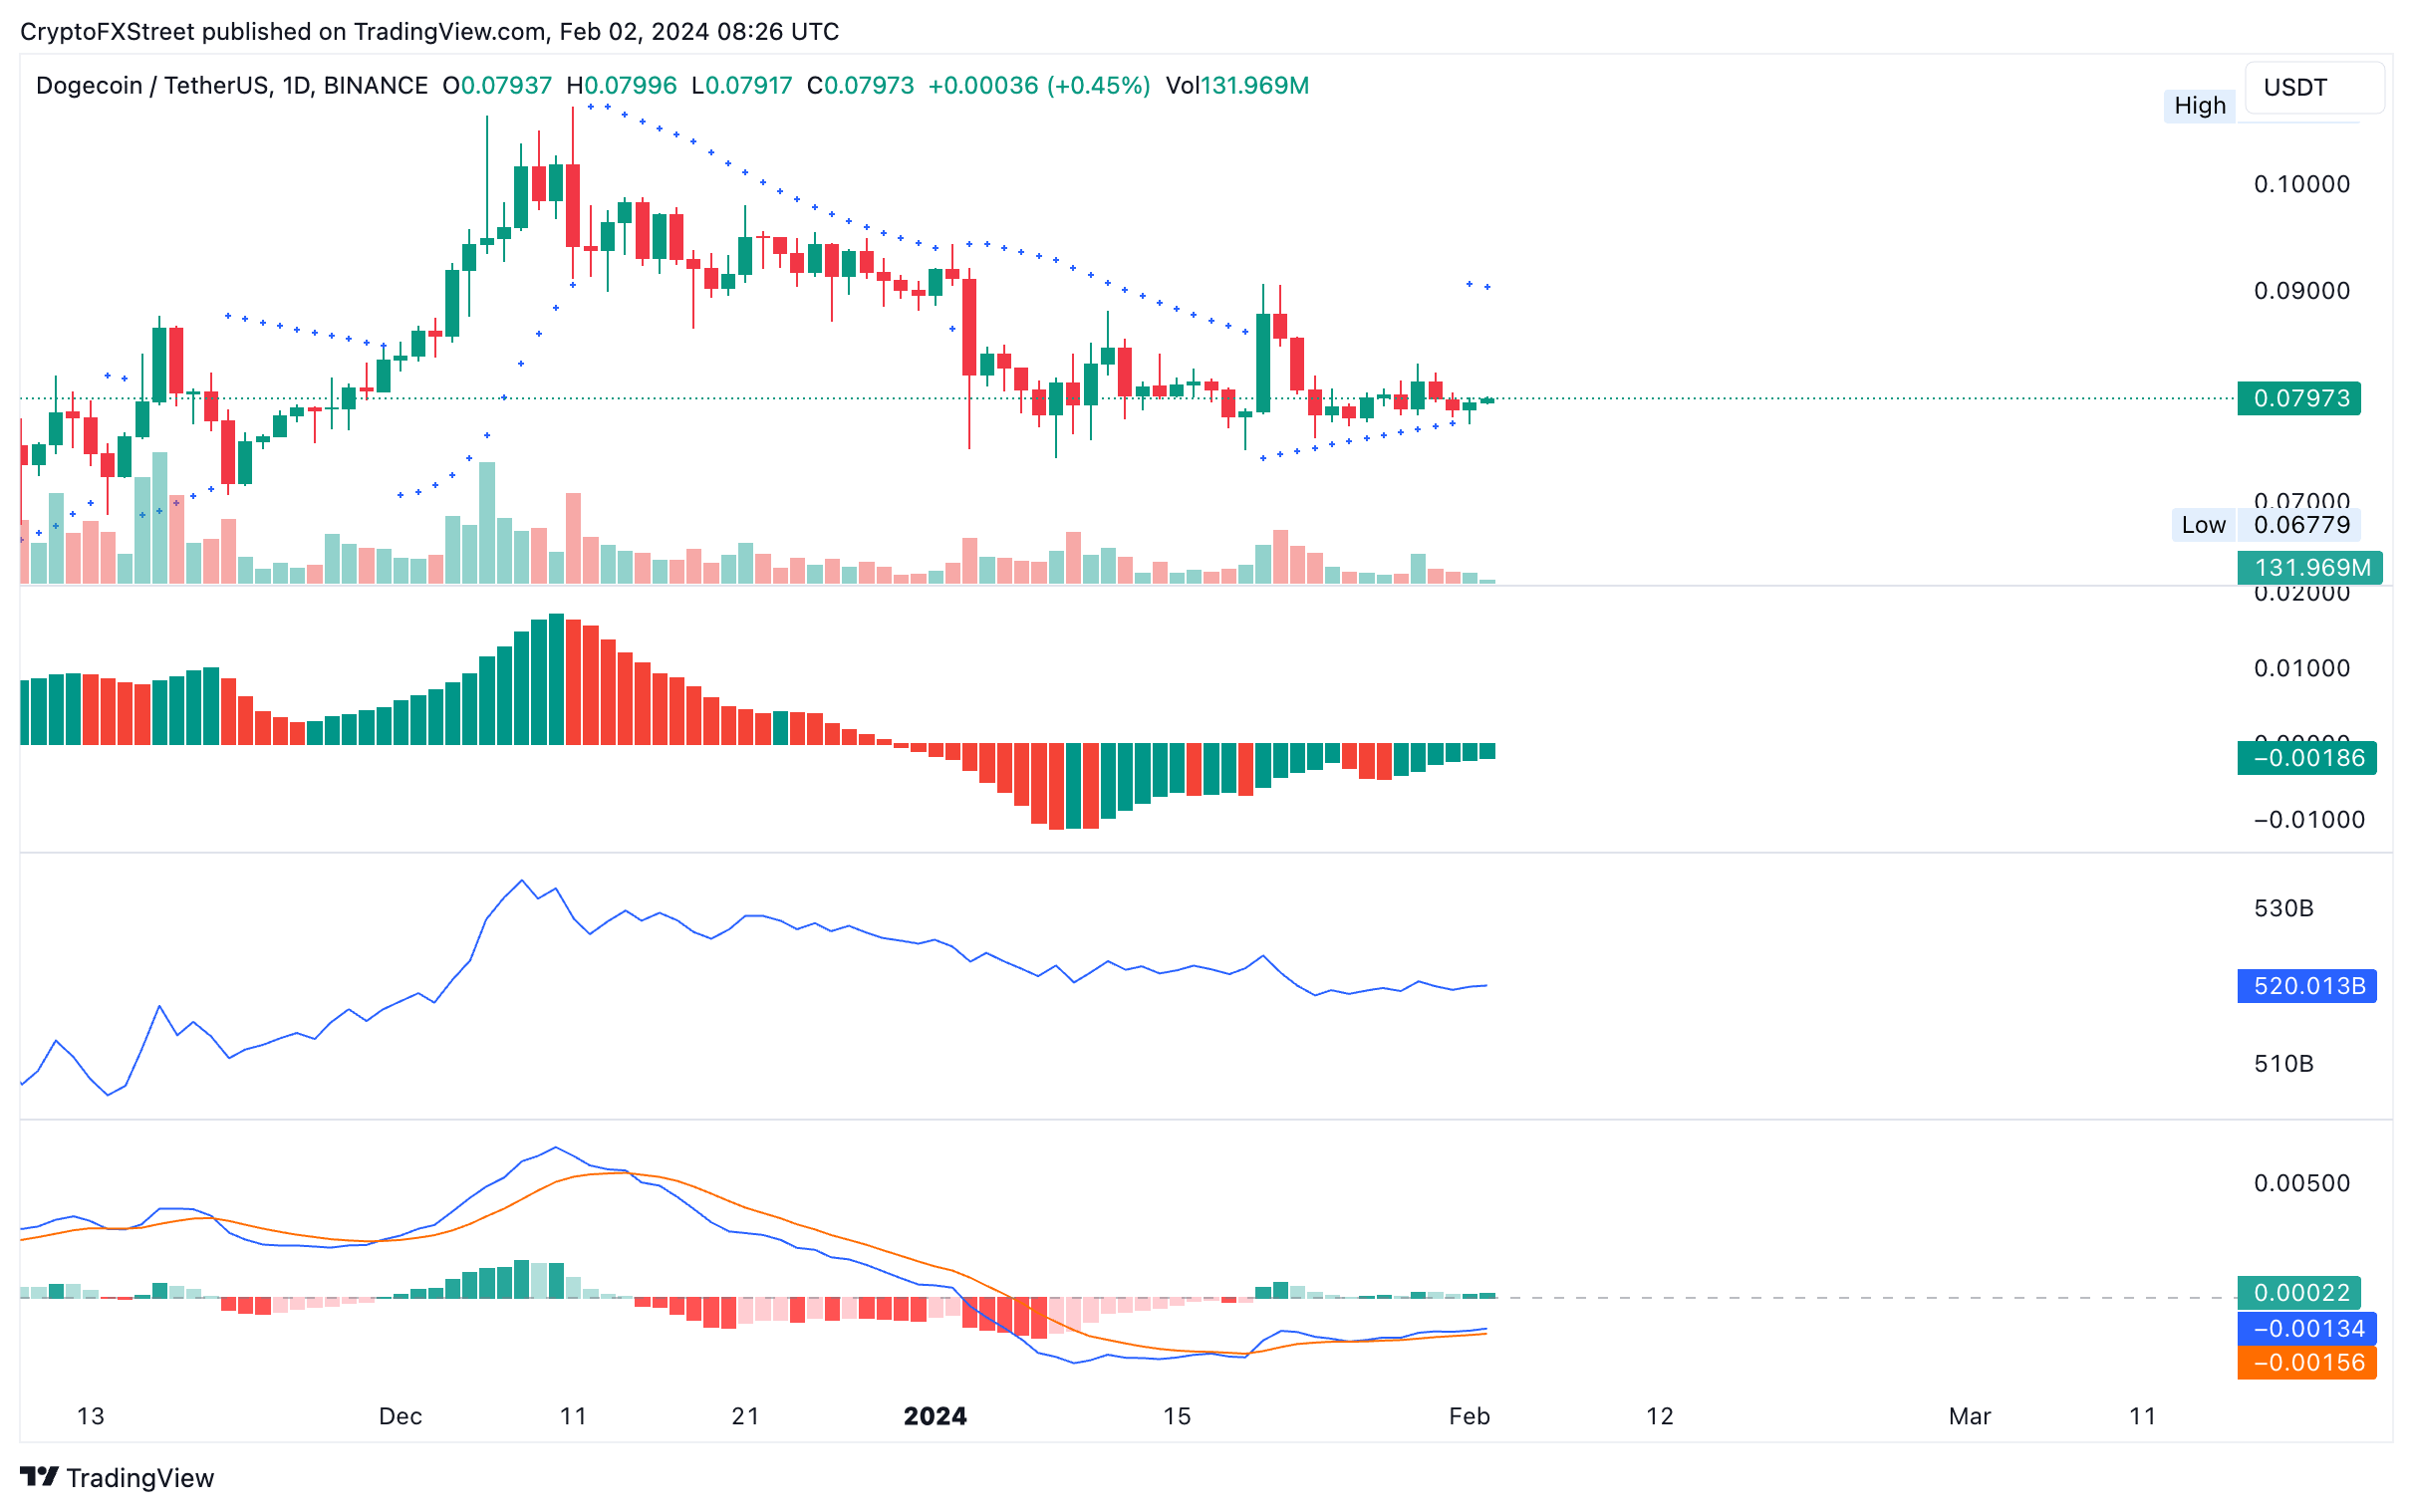
DOGE/USDT 1-week chart
Hence, caution is advised as DOGE may shed all its gains in the last week as bearish sentiments start to gather.


