- Dogecoin price rose by 185% since the last week of October.
- On-chain metrics suggest whales may be interested in taking profit.
- Invalidation of the bullish trend is a breach below $0.10.
Dogecoin price pulled off a jaw-dropping rally during the final days of October. The majority of the technical indicators suggest DOGE will continue to rise. Key levels have been defined to determine the notorious meme coin's next targets.
Dogecoin price is way up
Dogecoin price stunned the crypto market as a rocket-like rally took place during the final days of October. On November 2, after establishing a high at $0.158, the DOGE price found itself 185% above the prices it traded at for several weeks during the summer.
Dogecoin price currently auctions at $0.1309. The uptrend has established a classic ramping pattern on the Volume Profile Indicator, while the Relative Strength Index (RSI) is now in extremely overbought conditions. As the 8-day exponential and 21-day simple moving averages hover below the current auctioning price, there is no clear sign that the uptrend is over.
On-chain metrics show that some whales in the market are satisfied with their recent gains and may be sidelined unless a better-discounted DOGE price is offered.
Santiment's Daily Active Addresses show a significant uptick in movement, suggesting DOGE investors are interested in taking profits. Furthermore, the Whale Transaction Count shows a massive uptick in activity, the largest influx of movement this year. The indicator is based on whales transferring over $100,000 of DOGE. Statistically, the peaks of this indicator came in near a market reversal this year. Thus, the newly established bull run could be in jeopardy based on this indicator.
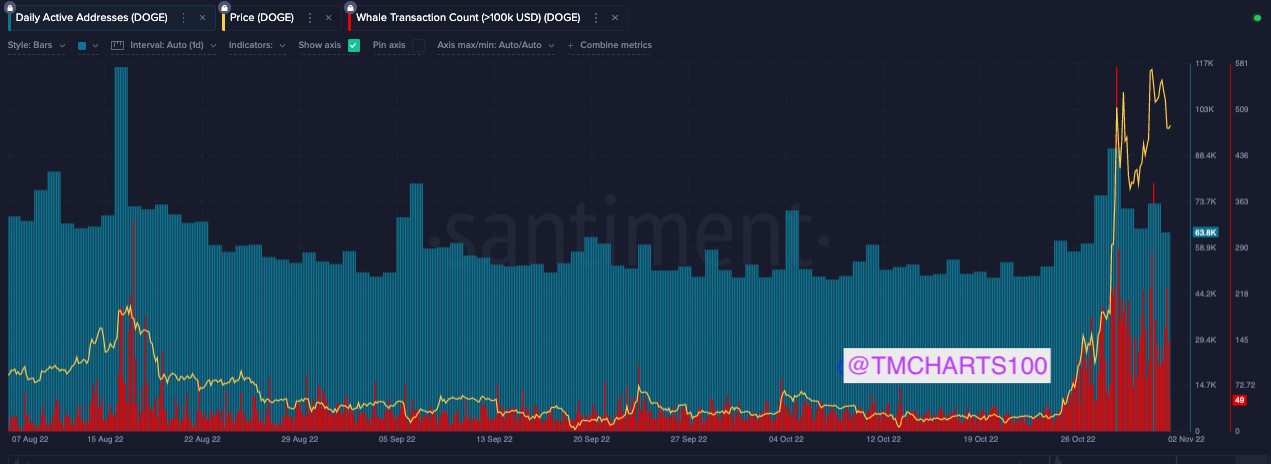
Santiment's Daily Active Address, Price and Whale Transaction (>100k) Indicators
Considering these factors, sidelined bulls may want to practice healthier risk management techniques during this highly volatile environment. If market conditions are genuinely bullish, a pump towards $0.17 could occur in the coming days, resulting in an additional 20% rise.
On the contrary, if the on-chain metrics are correct, a breach below the 8-day exponential moving average at $0.10 could wreak havoc on the DOGE price. The breach would give the bears confidence to aim for the 21-day simple moving average at $0.08. Such a move would result in a 40% decrease from the current Dogecoin price.
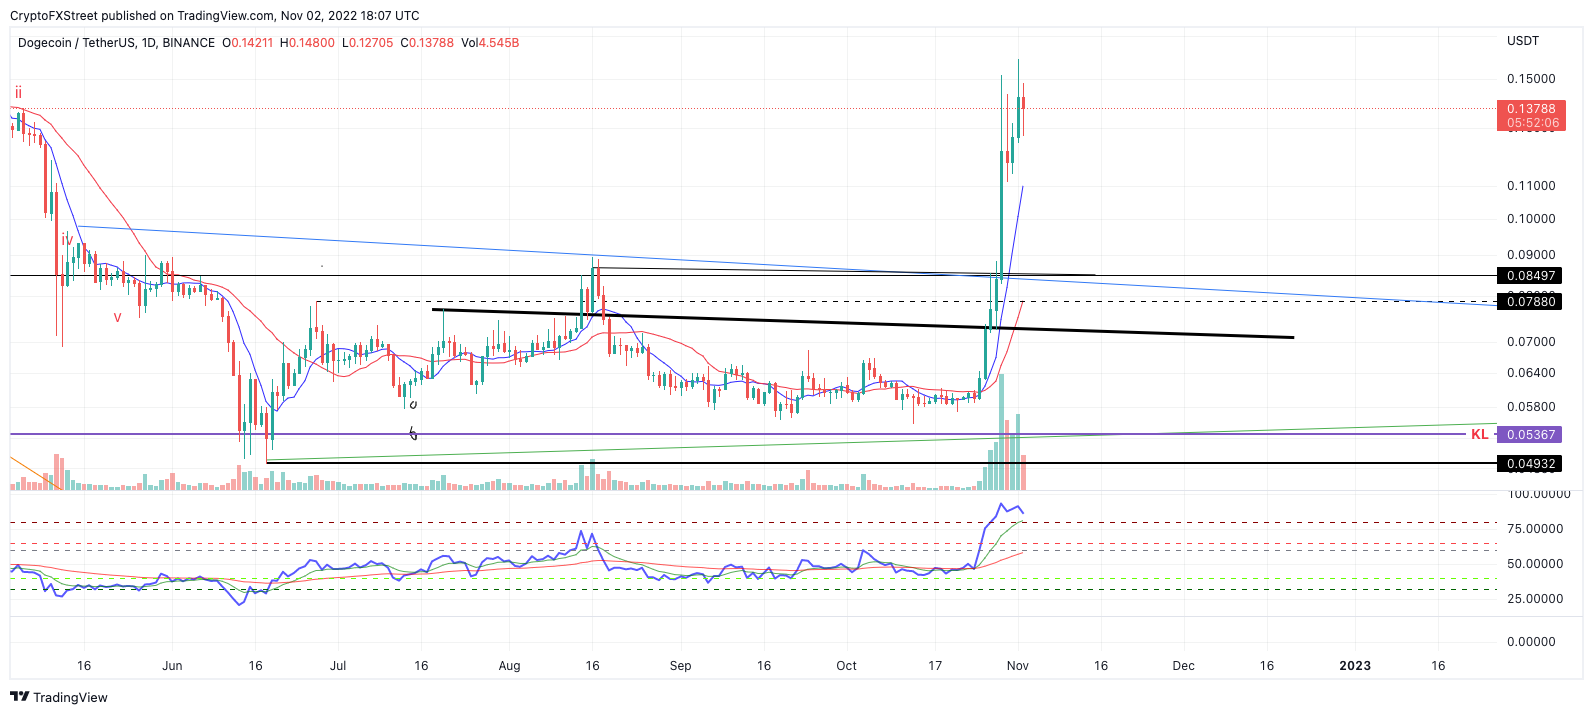
DOGE/USDT 1-Day Chart
In the following video, our analysts deep dive into the price action of DOGE, analyzing key levels of interest in the market. -FXStreet Team
Information on these pages contains forward-looking statements that involve risks and uncertainties. Markets and instruments profiled on this page are for informational purposes only and should not in any way come across as a recommendation to buy or sell in these assets. You should do your own thorough research before making any investment decisions. FXStreet does not in any way guarantee that this information is free from mistakes, errors, or material misstatements. It also does not guarantee that this information is of a timely nature. Investing in Open Markets involves a great deal of risk, including the loss of all or a portion of your investment, as well as emotional distress. All risks, losses and costs associated with investing, including total loss of principal, are your responsibility. The views and opinions expressed in this article are those of the authors and do not necessarily reflect the official policy or position of FXStreet nor its advertisers. The author will not be held responsible for information that is found at the end of links posted on this page.
If not otherwise explicitly mentioned in the body of the article, at the time of writing, the author has no position in any stock mentioned in this article and no business relationship with any company mentioned. The author has not received compensation for writing this article, other than from FXStreet.
FXStreet and the author do not provide personalized recommendations. The author makes no representations as to the accuracy, completeness, or suitability of this information. FXStreet and the author will not be liable for any errors, omissions or any losses, injuries or damages arising from this information and its display or use. Errors and omissions excepted.
The author and FXStreet are not registered investment advisors and nothing in this article is intended to be investment advice.
Recommended Content
Editors’ Picks
Bitcoin, Ethereum prices struggle after mixed US NFP data

BTC and ETH prices experienced a temporary pullback as crypto market participants reacted to the news of the US NFP data release for May. Similar to the situation in April, the number of Nonfarm Payrolls added far exceeded the market’s expectations.
Solana: A break above $26.30 would spell doom for bears

SOL price has been trading with a bullish bias after an explosive breakout on December 30. However, because of volatility and the gloom in the broader crypto market, SOL has been unable to break above a key hurdle at $26.30, causing the price to trade sideways.
Bitcoin Weekly Forecast: BTC targets $30,000 as short-term bias turns bullish

Bitcoin (BTC) price shows a clear sign of the bulls’ victory. After failing to trigger a steep correction, bears look now out of context, at least in the short term, allowing buyers to restart a minor uptrend.
China crypto community picks Ethereum, Arbitrum and BNB Chain as top protocols

Ethereum, Arbitrum and BNB Chain protocols are top picks for the Chinese crypto community, data from a report shows, a possible bullish catalyst for tokens related to these protocols as Hong Kong opens the door of crypto to retail investors.
Bitcoin: BTC targets $30,000 as short-term bias turns bullish

Bitcoin (BTC) price shows a clear sign of the bulls’ victory. After failing to trigger a steep correction, bears look now out of context, at least in the short term, allowing buyers to restart a minor uptrend.