Dogecoin Price Prediction: DOGE recovery in jeopardy, on-chain metrics suggest
- Dogecoin is having a difficult time renewing the uptrend following the correction from $0.088.
- The IOMAP model and the network growth models suggest that recovery will not be a walk in the park.
- DOGE will abandon the potential breakdown to $0.35 if it closes the day above the 100 SMA.

Dogecoin has been declining in a descending parallel channel after suffering rejection from the record high of $0.088. It appears that the impact caused by Elon Musk has diminished, allowing Doge to seek consolidation. Meanwhile, the 'Meme Coin' is rocking at $0.053 in a generally downwards market.
Dogecoin struggles to reclaim critical support levels
Following the correction from the all-time high, Dogecoin has not managed to reverse the trend. Several support levels have been shattered, including $0.07, $0.06, the 50 Simple Moving Average (SMA), and the 100 SMA on the 4-hour chart.
Similarly, it is worth noting that the break below the middle boundary of the channel opened the door to more losses. For now, bulls are tasked with defending the lower edge of the channel; otherwise, DOGE will freefall to the 200 SMA, currently at $0.035.
The Moving Average Convergence Divergence (MACD) validates the bearish outlook as it closes in on the midline. In the meantime, consolidation likely to take precedence because the MACD line (blue) and the signal line do not show any clear sense of direction.
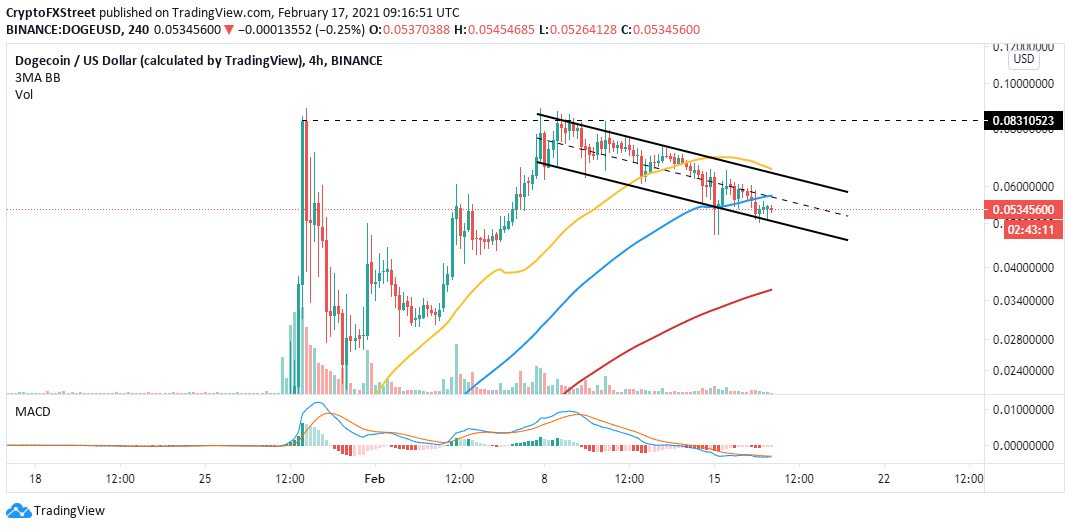
DOGE/USD 4-hour chart
A comprehensive look at the IOMAP model developed by IntoTheBlock (ITB) brings to light increasing overhead pressure, likely to delay Dogecoin recovery. The IOMAP displays key buying and selling positions, which can be used as anticipated support or resistance.
The region between $0.054 and $0.056 hosts nearly 57,000 addresses that had previously bought 8.5 billion DOGE. Other medium-strong seller concentration zones can be observed toward $0.06, implying achieving a new all-time high will be an uphill battle.
-637491531221950771.png)
Dogecoin IOMAP chart
On the flip side, Dogecoin is not strongly supported. However, the IOMAP directs the traders' attention to the range running from $$0.048 to $0.05. Here, roughly 12,800 addresses had previously bought approximately 4.5 billion DOGE.
The "Daily New Addresses" model by ITB adds weight to the bearish outlook due to the consistent drop in the number of new addresses joining the network. Dogecoin's unique addresses topped out at nearly 134,000 on January 29, but this figure has declined to roughly 37,000 addresses per day.
In other words, the network is not receiving the attention it was receiving toward the end of January. The token inflows and outflows have also been impacted negatively. Thus, recovery will be difficult, or DOGE may continue to drop in value.
-637491531372446602.png)
Dogecoin new addresses chart
Looking at the other side of the fence
Note that holding above $0.05 and the descending channel lower boundary support may avert the potential freefall to $0.035. Simultaneously, reclaiming support at the 100 SMA and perhaps the middle boundary will pave the way for gains above $0.06 while setting Dogecoin on another path to new all-time highs.
Author

John Isige
FXStreet
John Isige is a seasoned cryptocurrency journalist and markets analyst committed to delivering high-quality, actionable insights tailored to traders, investors, and crypto enthusiasts. He enjoys deep dives into emerging Web3 tren


