- Dogecoin price is contained inside a descending triangle pattern on the 4-hour chart.
- A key indicator is on the verge of presenting a strong buy signal.
- A breakout could quickly push Dogecoin price towards $0.076.
The hype for Dogecoin might have faded away, but the digital asset still shows signs of bullish moves. A key indicator is about to present a buy signal that could drive Dogecoin price to new highs at $0.076.
Dogecoin price is on the verge of a massive 40% breakout
On the 4-hour chart, DOGE has established a descending triangle pattern with a resistance trendline formed at $0.0544. A breakout above this point will quickly push Dogecoin price towards $0.076, a 40% move calculated using the height of the pattern as a reference guide.
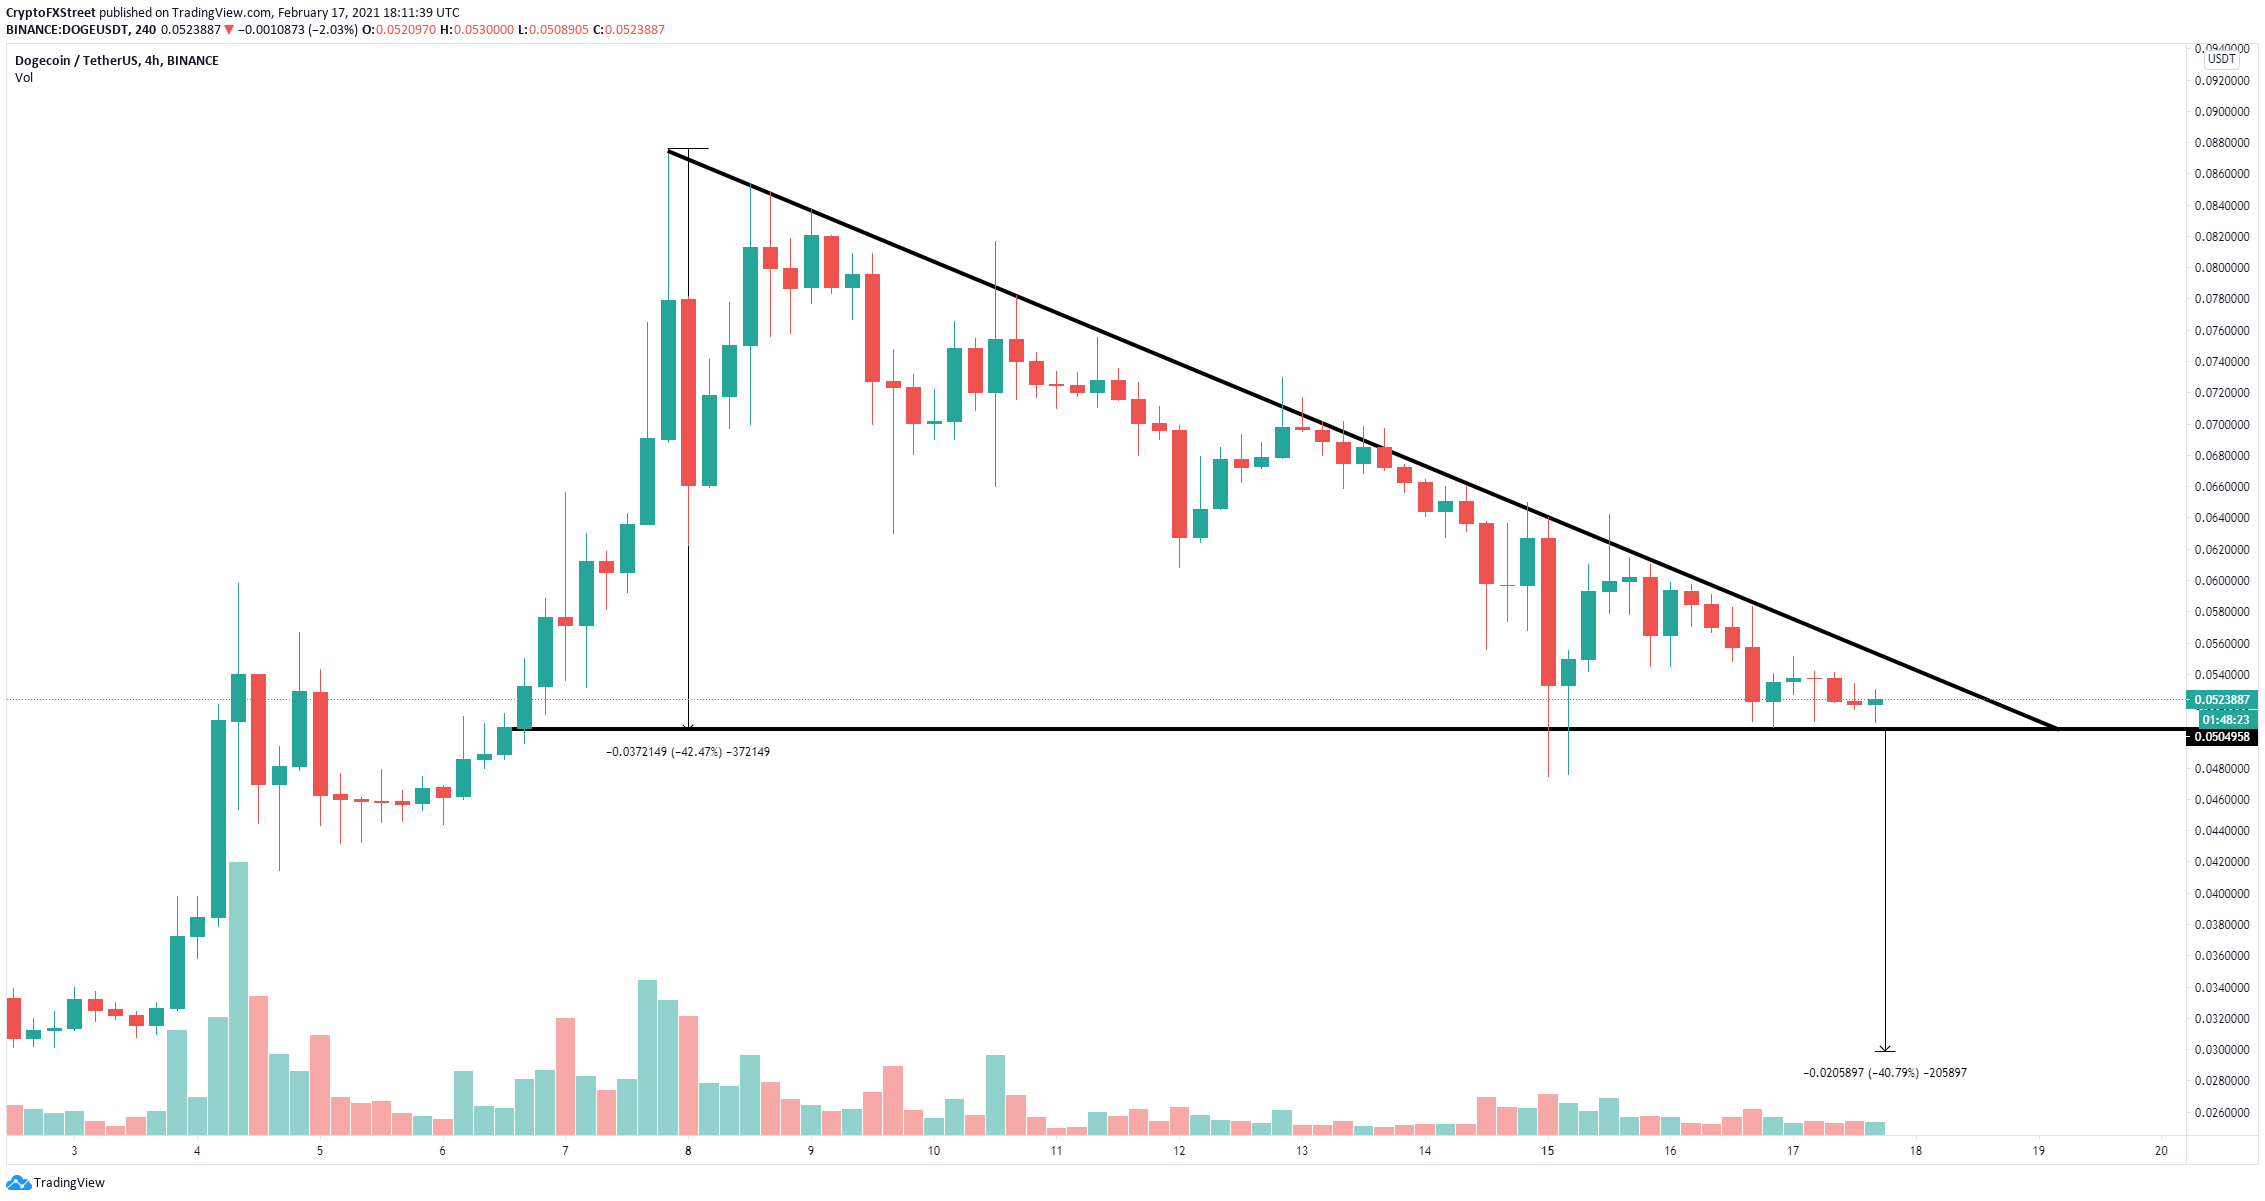
DOGE/USD 4-hour chart
Additionally, on the 12-hour chart, the TD Sequential indicator has just created a red '8' candlestick, usually followed by a buy signal. Climbing above the 26-EMA resistance level at $0.0574 would validate this call.
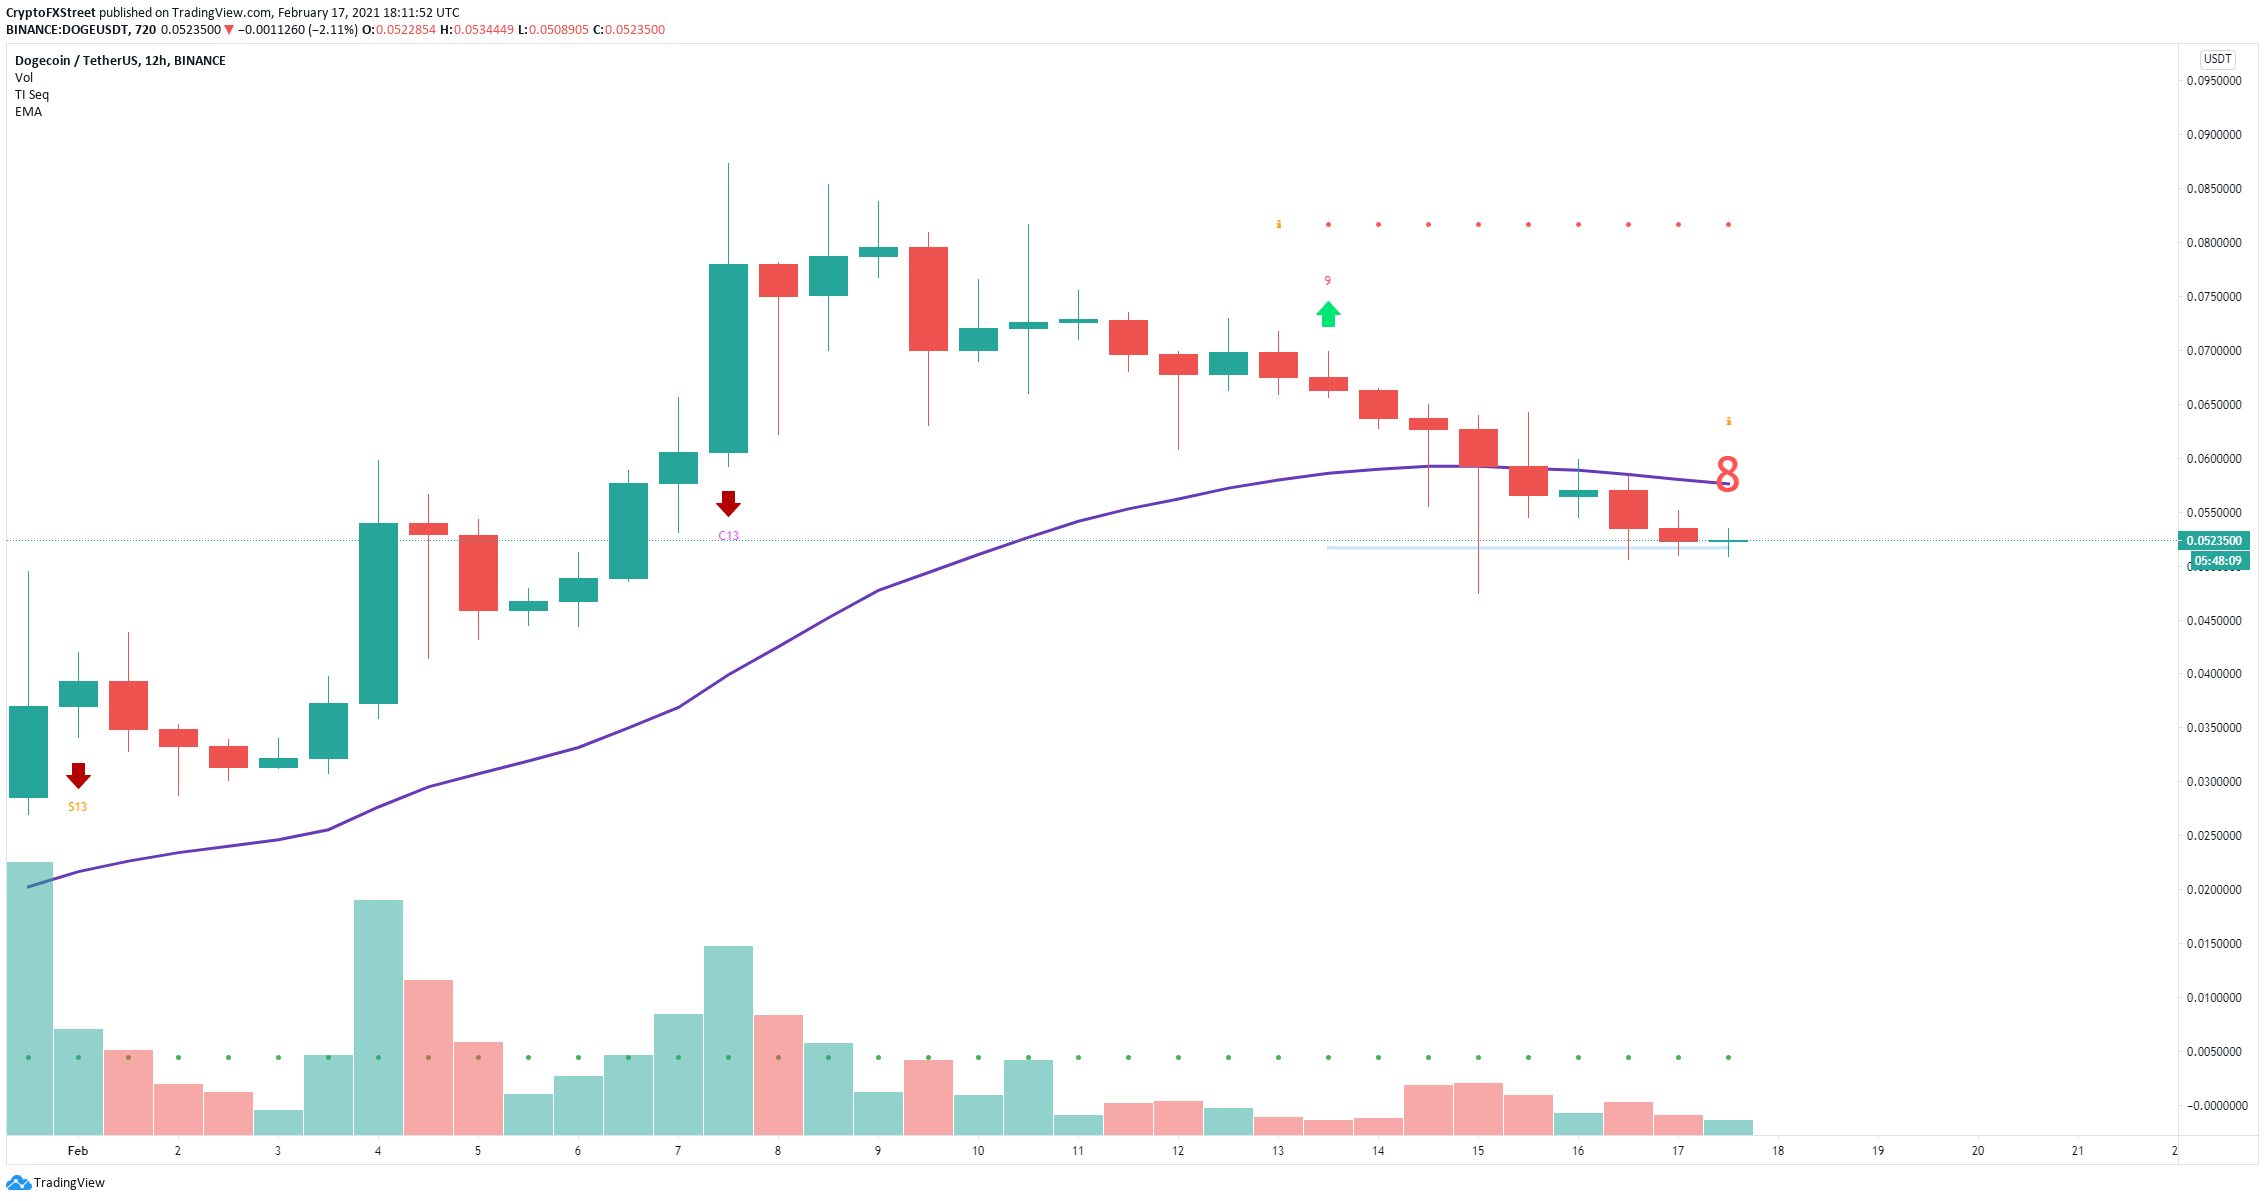
DOGE/USD 12-hour chart
However, the triangle pattern could also break bearishly if DOGE can't hold the critical support level at $0.05. A breakdown below this point will drive Dogecoin price down to $0.03.
Note: All information on this page is subject to change. The use of this website constitutes acceptance of our user agreement. Please read our privacy policy and legal disclaimer. Opinions expressed at FXstreet.com are those of the individual authors and do not necessarily represent the opinion of FXstreet.com or its management. Risk Disclosure: Trading foreign exchange on margin carries a high level of risk, and may not be suitable for all investors. The high degree of leverage can work against you as well as for you. Before deciding to invest in foreign exchange you should carefully consider your investment objectives, level of experience, and risk appetite. The possibility exists that you could sustain a loss of some or all of your initial investment and therefore you should not invest money that you cannot afford to lose. You should be aware of all the risks associated with foreign exchange trading, and seek advice from an independent financial advisor if you have any doubts.
Recommended Content
Editors’ Picks
XRP price stuck under $0.65 despite Bitcoin hitting $38,000 three times in one week

Ripple (XRP) and Bitcoin (BTC) prices do not show parity. Despite both featuring among the crypto top three, Ripple price is stuck under $0.6500 while Bitcoin has managed to foray north, testing the $38,000 psychological level for the third time in a week.
FTX token FTT jumps 8% as exchange wins approval to start selling $744 Million in Grayscale and Bitwise assets

FTX token (FTT) has jumped 8% following news that a US bankruptcy court of Delaware has allowed the now-defunct cryptocurrency exchange to move forward with a November 6 request.
Optimism price slips under critical support as $40 million worth of OP due to flood market Thursday

Optimism (OP) price has dropped 5% in the last day, but trading volume is up a stark 15% over the last 24 hours as of press time. The disparity comes amid expectations of more tokens in the OP market relative to what traders are willing to buy at current prices.
Pando becomes thirteenth BTC ETF applicant as BlackRock presents revised in-kind model
/definition-of-etf-21007500_XtraSmall.jpg)
Amid the ongoing spot Bitcoin ETFs race, a new player has joined the marathon. Pando Asset AG has become the thirteenth applicant even as the US Securities & Exchange Commission (SEC) continues to engage with prospective issuers.
Three key BTC accumulation levels before ETF approval in January 2024

Bitcoin, from a high time-frame perspective, has been in an up-only trend since the start of 2023. BTC has ignored many sell signals due to the likelihood of an Exchange-Traded Fund approval. With the holidays around the corner, falling liquidity could see BTC discounted from its current level, hovering around the $37,000 region.