Dogecoin price poised for a rally as on-chain metrics show bullish bias
- Dogecoin's open interest is rising, indicating new buying is occurring.
- DOGE’s long-to-short ratio is above one, suggesting more traders anticipate a price rise.
- Santiment’s daily trading volume metric spiked, indicating more usage and activity in DOGE’s blockchain.

Dogecoin (DOGE) extends its gains on Friday after rallying over 16% since Monday. DOGE’s on-chain metrics further support this rise: its open interest is rising, the long-to-short ratio is above one and spikes in daily trading volume all hint at the continuation of the rally.
DOGE on-chain metrics show positive bias
Coinglass’s data shows that the futures’ Open Interest (OI) in Dogecoin at exchanges is increasing. Increasing OI represents new or additional money entering the market and new buying, which suggests a bullish trend. When OI decreases, it is usually a sign that the market is liquidating, more investors are leaving, and the current price trend is ending.
The graph below shows that Dogecoin’s OI increased from $593.66 million on Wednesday to $889.53 million on Friday, the highest level since early June.
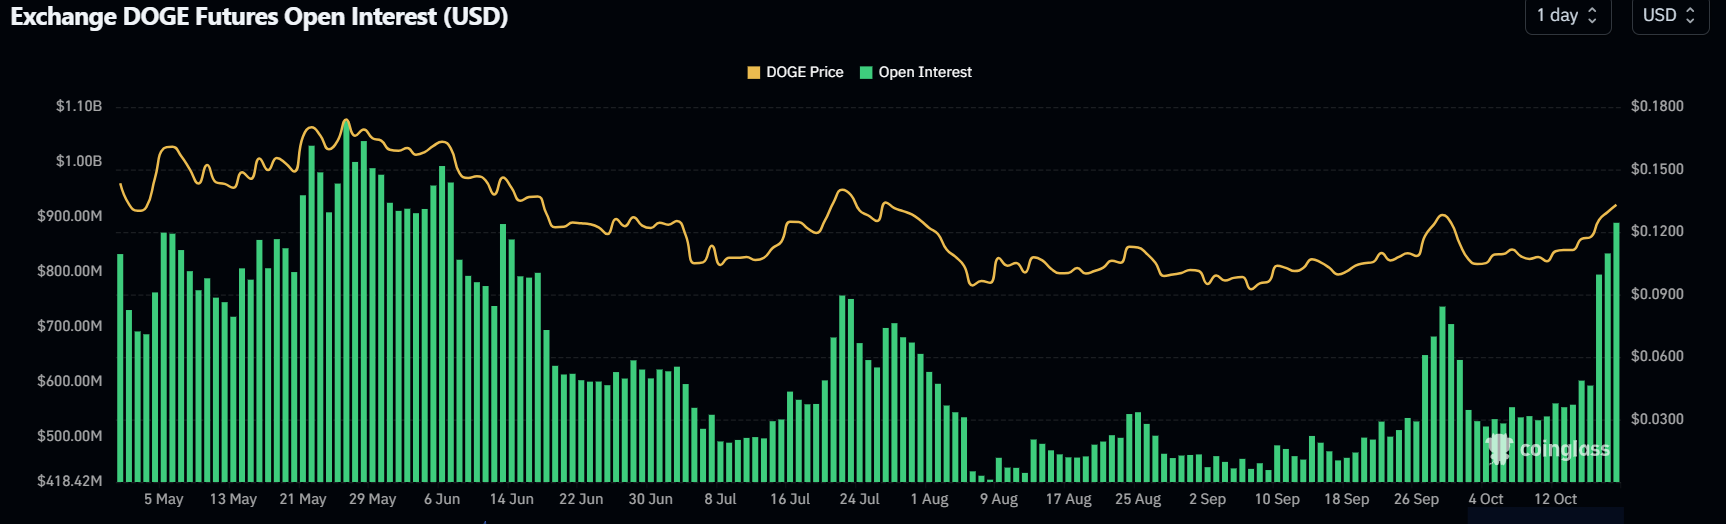
Dogecoin Open Interest chart. Source: Coinglass
Furthermore, Dogecoin’s long-to-short ratio data from Coinglass also projects a bullish outlook for DOGE. The ratio currently stands at 1.06, the highest level in one month. This ratio reflects bullish sentiment in the market, as the number above one suggests that more traders anticipate the price of the asset to rise.
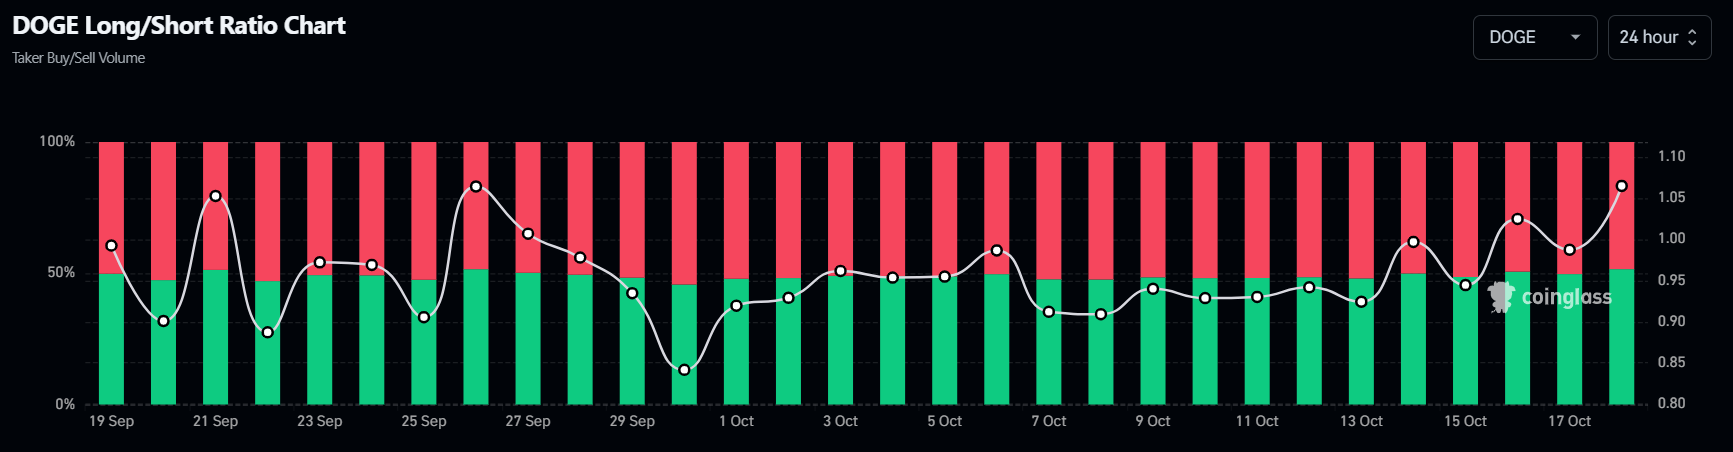
DOGE’s long-to-short ratio. Source: Coinglass
Another aspect bolstering the platform’s bullish outlook is a recent surge in traders’ interest and liquidity in the DOGE chain. Santiment’s data shows that Dogecoin's daily trading volume rose from $573.27 million on Sunday to $2.27 billion on Wednesday, the highest since early August.
%20[09.38.06,%2018%20Oct,%202024]-638648239604742451.png)
Dogecoin daily trading volume chart. Source: Santiment
Author

Manish Chhetri
FXStreet
Manish Chhetri is a crypto specialist with over four years of experience in the cryptocurrency industry.


