Dogecoin Price Forecast: DOGE faces uphill battle
- Dogecoin price has failed to stay above crucial support levels, hinting at overwhelming bearish pressure.
- The short-term selling pressure has pushed DOGE back into a symmetrical triangle consolidation.
- A reversal in bullish outlook is possible if the meme coin slices through a crucial demand barrier at $0.047.

The Dogecoin price saw a massive spike on April 1, when Elon Musk tweeted about DOGE. However, the quick run-up has retraced almost all of its surge.
Dogecoin price struggles to stay afloat
On the 12-hour chart, the Dogecoin price has formed a symmetrical triangle consolidation since February 18. Trend lines drawn along the lower highs and higher lows show a converging trend, resulting from aggressive camps trying to control the asset.
This setup forecasts a 35% move, determined by measuring the pivot high and low distance and adding it to the breakout point.
Since this technical formation has no inherent bias, a decisive close above $0.061 suggests a 36% upswing to $0.083. However, a breakdown of the symmetrical triangle’s lower trend line at $0.051 shows a downward trajectory for the Dogecoin price toward $0.033.
On April 1, Elon Musk tweeted that SpaceX was “going to put a literal Dogecoin on the literal moon.” As a result, DOGE surged 31% in a single 4-hour candle as it shattered overhead barriers at $0.059 and 0.066.
Soon after, the Dogecoin price undid most of its gains as investors booked profits. This move pushed DOGE back into the consolidation phase. If this trend continues, the meme coin could retest the setup’s lower boundary at $0.051 and perhaps even slice through it, establishing a downtrend.
In that case, DOGE could drop 7.5% toward the Momentum Reversal Indicator’s (MRI) breakout line at $0.047.
If the selling pressure persists, the bears could drag the Dogecoin price by an additional 12% to $0.041.
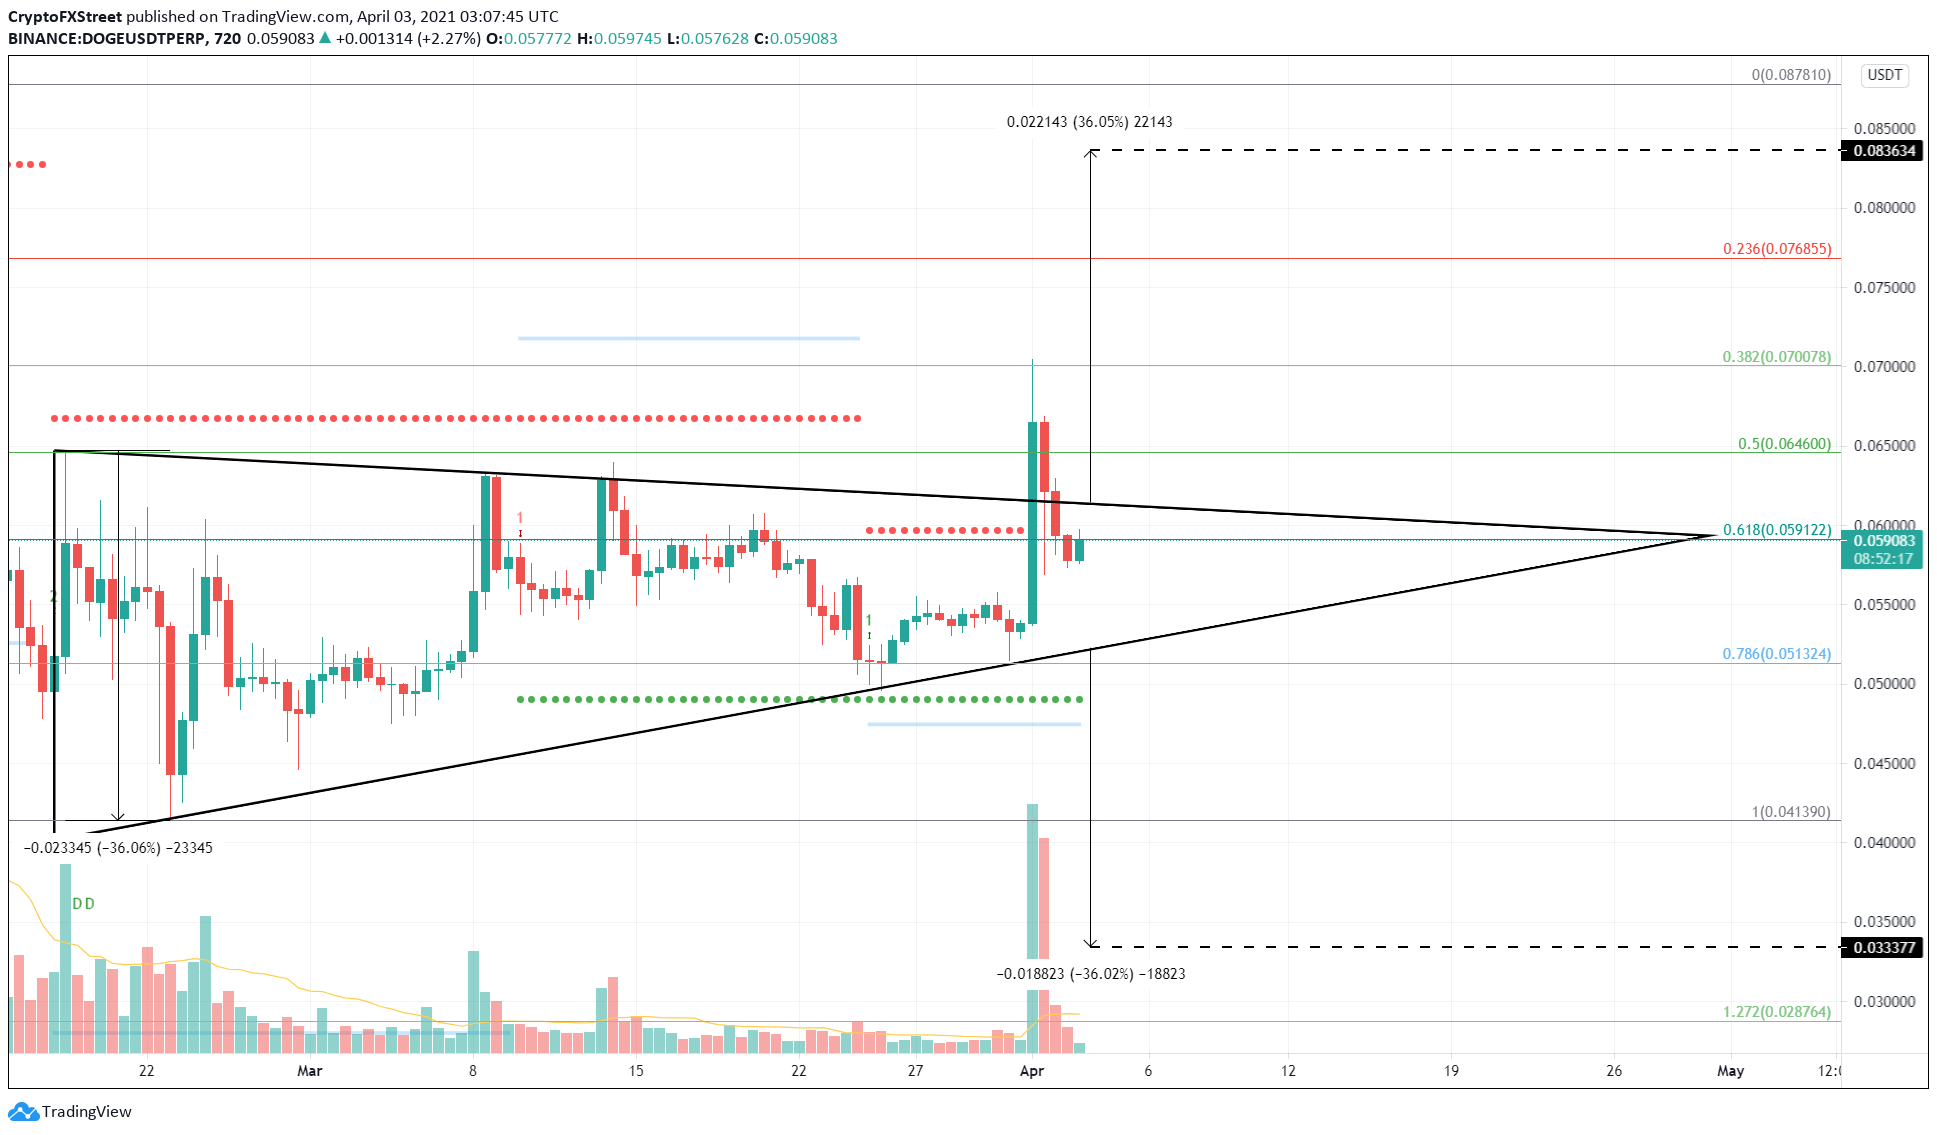
DOGE/USDT 12-hour chart
Adding credence to the bearish outlook is IntoTheBlock’s In/Out of the Money Around Price (IOMAP) model, which shows a massive supply barrier at $0.061. Here roughly 52,200 addresses that purchased nearly 15 billion DOGE are “Out of the Money.”
Therefore, this barrier will be a tough nut to crack. More so, the demand barriers below DOGE’s current price level are small but stacked together. Hence, a sudden spike in selling pressure could create a domino effect that topples all the support levels.
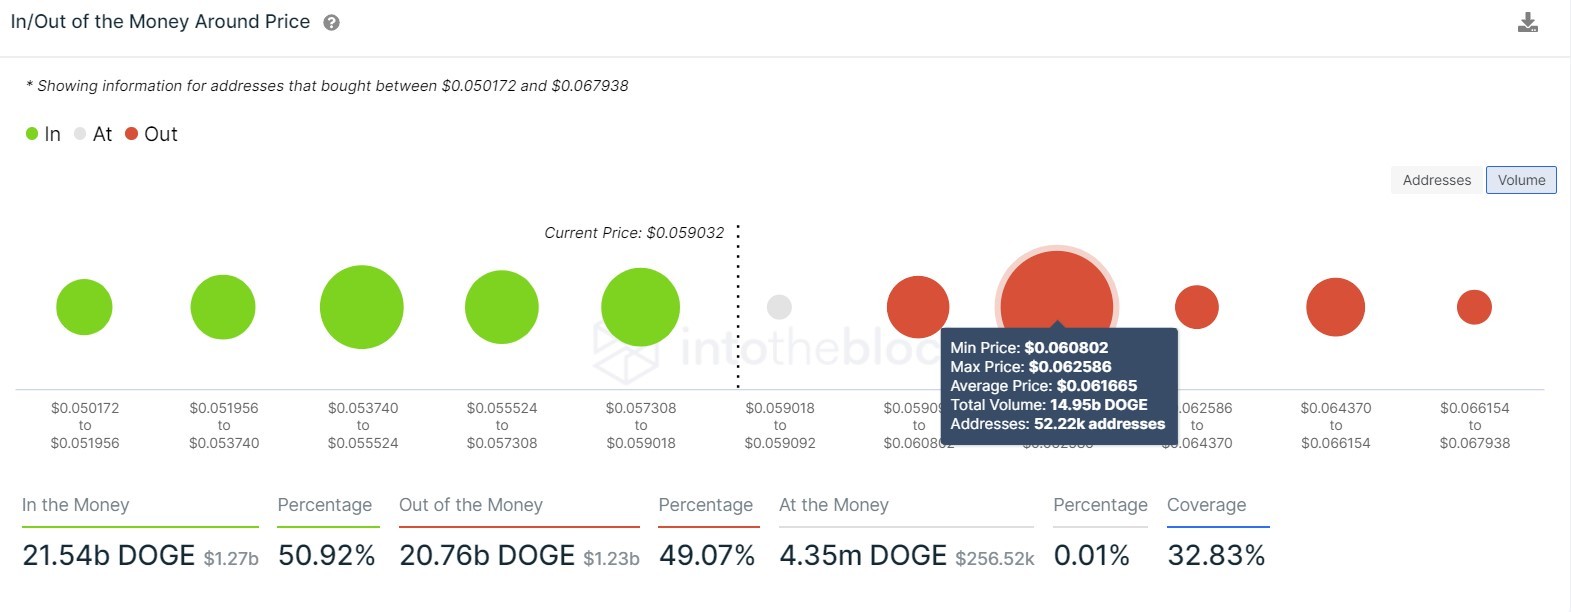
Dogecoin IOMAP chart
However, an unexpected surge in bullish momentum due to Musk’s tweet or a celebrity could send the Dogecoin price lying. In such a scenario, DOGE might quickly slice through the overhead barriers mentioned above.
A decisive close above the MRI’s breakout line at $0.071 could help the Dogecoin price surge 16% to achieve its intended target at $0.083.
Author

Akash Girimath
FXStreet
Akash Girimath is a Mechanical Engineer interested in the chaos of the financial markets. Trying to make sense of this convoluted yet fascinating space, he switched his engineering job to become a crypto reporter and analyst.


