Dogecoin price could see a 10% to 15% upswing if this key level is conquered
- Dogecoin price hints at an increased buyer activity suggesting the start of an uptrend.
- The $0.053 level could make or break DOGE’s fate.
- Transactional data shows that Dogecoin will face stiff resistance at $0.058 and $0.061.

Dogecoin price shows an 8% surge in the last three hours, indicating an increase in buying activity. This sudden uptick has caused DOGE to slice through the crucial level at $0.053. However, only a decisive close above this level will decide DOGE’s fate.
Dogecoin price hints at an uptick in bullish momentum
Dogecoin price shows an increase in buying activity, which has pushed the altcoin through the no-trade zone’s upper boundary, ranging from $0.046 to $0.052. This uptick in bullish momentum has also caused the Bollinger bands to expand, indicating an increase in volatility, potentially to the upside. Moreover, it has also resulted in a buy signal after more than 20 days.
Only a 4-hour candlestick close above the SuperTrend indicator’s sell-signal at $0.053 will confirm this uptrend. At the time of writing, Dogecoin price has already blasted through this supply barrier, but the trading session hasn’t ended yet.
Assuming an optimistic outlook, DOGE could surge anywhere between 10% to 15% towards two critical supply barriers present at $0.058 and $0.061, respectively.
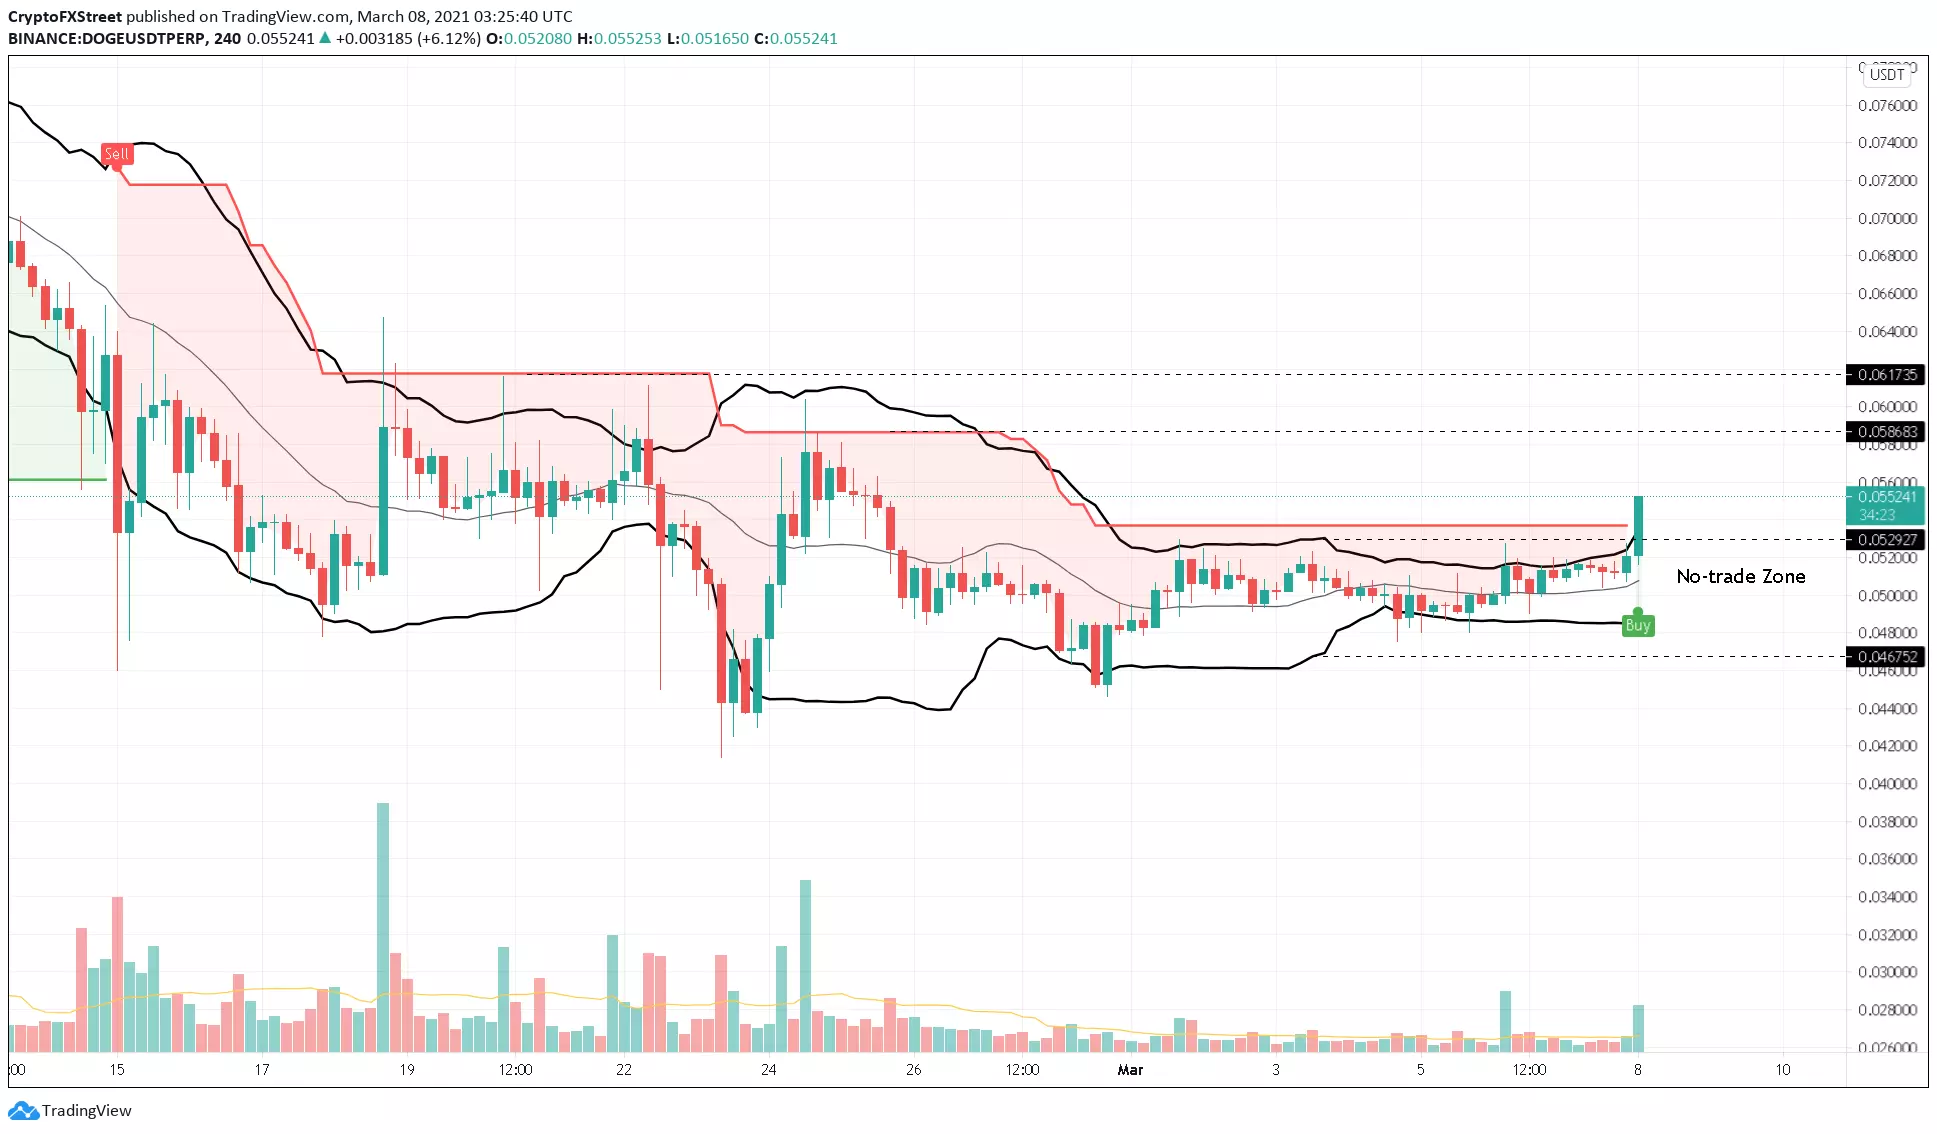
DOGE/USDT 4-hour chart
Adding credence to this bullish outlook is IntotheBlock’s In/Out of the Money Around Price (IOMAP) model, which shows the presence of stable support at $0.050, where nearly 87,000 addresses purchased roughly 11.48 billion DOGE.
IOMAP cohorts reveal a stiff resistance level at $0.058, where 31,800 addresses purchased 5 billion DOGE. This supply barrier is the first target and is 9% away from the critical level at $0.053. If DOGE manages to slice through this level, it could surge another 5% to hit the second target at $0.061.
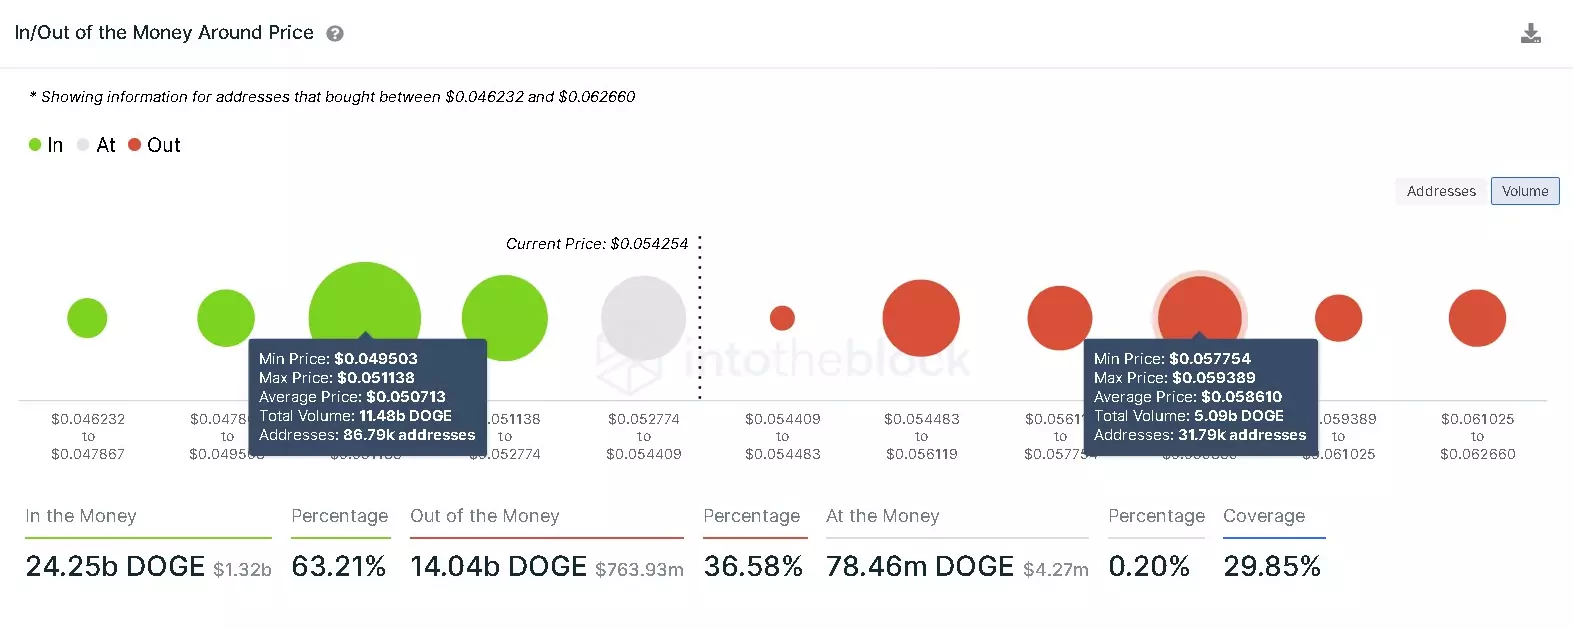
Dogecoin IOMAP chart
On the flip side, a failure to close above $0.058 could result in a downtrend. If this pullback slices through the critical level at $0.053, it will invalidate the bullish thesis. In this scenario, DOGE could drop to $0.046, which is the lower end of the no-trade.
Author

Akash Girimath
FXStreet
Akash Girimath is a Mechanical Engineer interested in the chaos of the financial markets. Trying to make sense of this convoluted yet fascinating space, he switched his engineering job to become a crypto reporter and analyst.



