Decentraland bulls deep fish for an entry-level before the breakout
- Decentraland is unable to stay above the 78.6% Fibonacci level at $3.00
- MANA looks to be breaking further to the downside as global sentiment weighs on investors’ beliefs.
- Expect a break lower, testing the low of 2022 and December 2021 before being picked up by bulls.

Decentraland (MANA) is not starting the year on a high note. For most of January, price action has been trading sideways to lower, and it does not look like current levels are the ones where investors are interested. Expect a lower break towards $2.60 or even $2.15 before investors start to scoop up MANA with profit targets to the upside.
With the RSI dipping lower, MANA price action first needs to correct lower before rallying higher again
Decentraland is keeping investors on edge as price action has been mostly sideways for the past few days. Each time MANA price action looked ripe gains, it faltered, and as a result failed to close above the 78.6% Fibonacci level at $3.00. As this level has been so chopped up these past few days, it has started to lose credibility, and bulls will not want to be trapped at such a level.
MANA price will need to correct a few percentages first, before investors will want to enter long positions again. A dip towards the low of 2022 at $2.57 or $2.15, the low of November 2021, and just below the monthly S1 support level, might both make valid entry points. With that, the Relative Strength Index (RSI) will enter oversold territory and trigger profit-taking among the short-sellers.
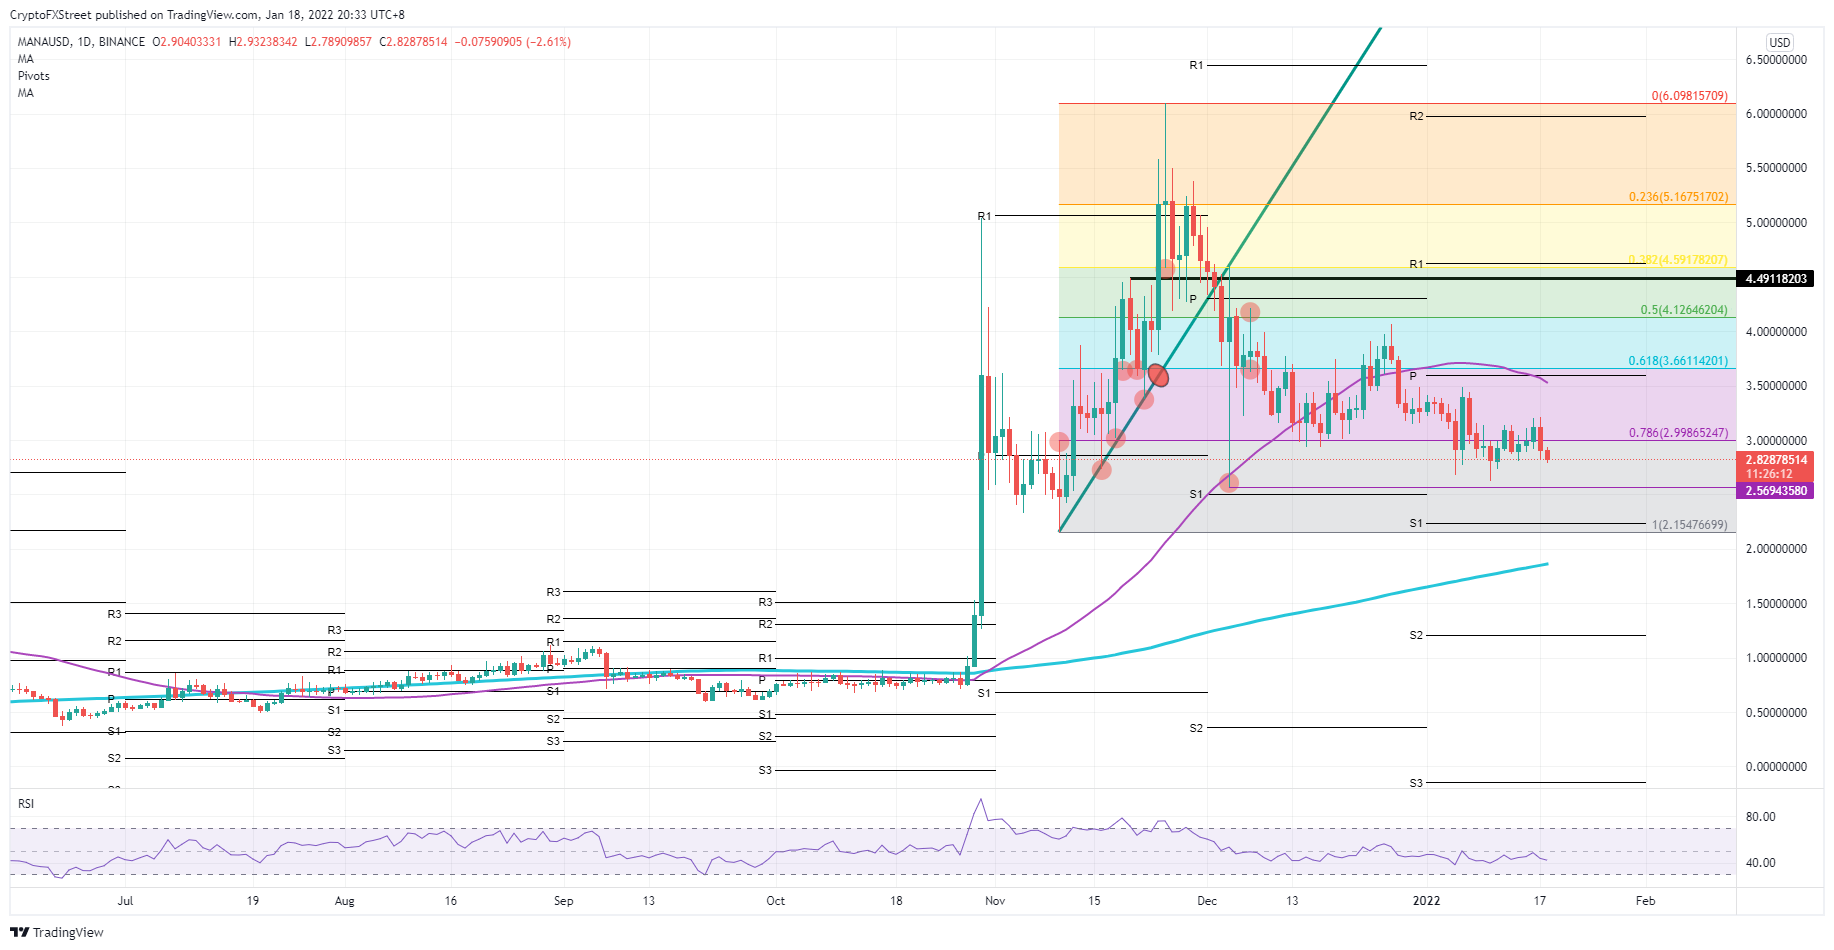
MANA/USD daily chart
Of course, sentiment can quickly shift on a single headline, and that is no different today. If a peace agreement were to come out of the NATO-Russia talks, for example, that would help sentiment, and spark a new rally for equities and risky assets that would also see buying across the board in cryptocurrencies. MANA price action would finally be able to leave $3.00 behind it and start to test $3.66, where the 55-day Simple Moving Average (SMA), the monthly pivot, and the 61.8% Fibonacci level all fall in place.
Author

Filip Lagaart
FXStreet
Filip Lagaart is a former sales/trader with over 15 years of financial markets expertise under its belt.


