Dash Price Forecast: DASH correction seems imminent aiming for $70
- Dash makes an entrance into the DeFi sector after a strategic partnership deal with StakeHound.
- A retreat is in the offing due to DASH/USD rejection at the 100-day SMA.

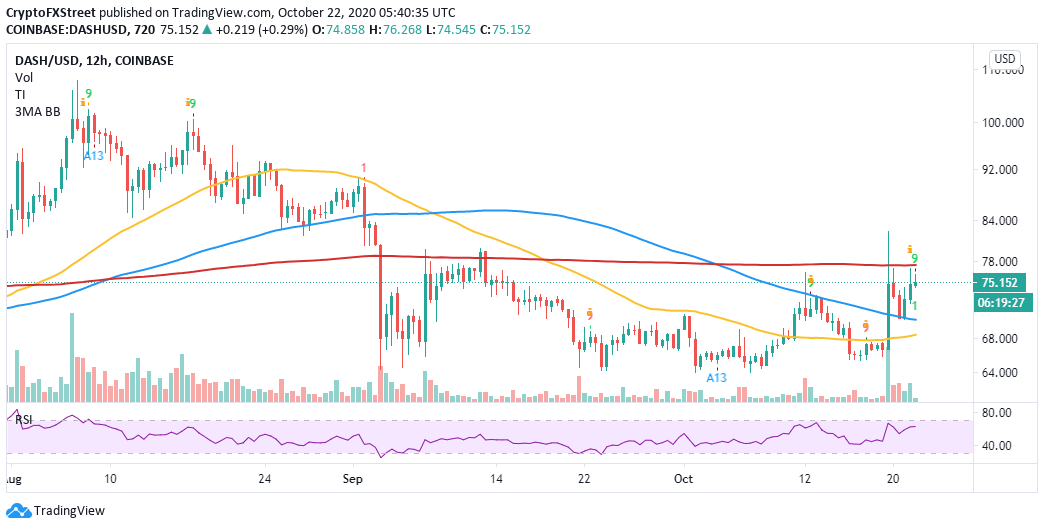
Dash recently exploded in the wake of pulling the 50-day Simple Moving Average resistance into the rearview, as discussed. The cryptoasset appears to have bottomed out at $65 amid a breakdown from August’s high of $105. A recovery ensued with DASH/USD closing in on the critical hurdle at $80. Unfortunately, Dash lost steam, hitting a barrier at $78.
Newly-created bridge links Dash to DeFi
Following a partnership with StakeHound, Dash users will soon have access to the decentralized finance (DeFi) sector. Essentially, tokens kept with StakeHound will be eligible to earn network rewards via the Dash masternode.
The process commences with Dash users depositing tokens in StakeHound. These tokens are instantly swapped into a wrapped ERC-20, referred to as StakedDASH. The new tokens are compatible with various DeFi platforms such as Curve Finance, UniSwap and Aave. Users can also convert the tokens into DASH.
On the other hand, Dash tokens will remain locked in a masternode where they will accrue a set standard rate for the network rewards. The new development opens the opportunity for DASH holders who could not meet the 1,000 tokens limit for operating a masternode. For now, only one DASH token is required to take part in staking.
Dash downside beckons following rejection
As earlier mentioned, DASH/USD rejection at $78, a resistance highlighted by the 100-day Simple Moving Average, cut short the rally from $65. A reversal is underway, with bulls working to avert losses to $70.
The 200-day SMA immediately cups upward movement. Exhaustion in the bullish camp is reinforced by the Relative Strength Index (RSI)’s inability to reach the overbought area. The horizontal motion highlights the calm before the storm.
DASH/USD daily chart
-637389419860316421.png)
The TD Sequential Indicator just flashed a sell signal in the form of a green nine candlestick. The call adds weight to the bearish narrative. On the downside, the lower leg might extend to the 100 SMA, which also functioned as recent support. In case of extended losses, the 50 SMA is in line to absorb the selling pressure, but the primary support lies at $65.
DASH/USD daily chart
Looking at the other side of the fence
Although most technical indicators are bearish, on-chain metrics and particularly IntoTheBlock’s IOMAP model, reveals the absence of selling pressure. In other words, the path with the least hurdles is upwards.
DASH IOMAP chart
-637389421293743939.png)
On the downside, immense support is accorded to the crypto, as shown by the model. The most robust buyer congestion zone runs from $73 to $74. Previously, nearly 72,000 addresses bought approximately 654,000 DASH in the range. It is doubtful that DASH will penetrate this zone for losses below $70.
Author

John Isige
FXStreet
John Isige is a seasoned cryptocurrency journalist and markets analyst committed to delivering high-quality, actionable insights tailored to traders, investors, and crypto enthusiasts. He enjoys deep dives into emerging Web3 tren


