Dash Technical Analysis: DASH breakdown to $65 looms after rejection at $75
- Dash seeks support at $70 to avert potential losses to $65.
- DASH/USD path of least resistance is downwards according to the IOMAP model.

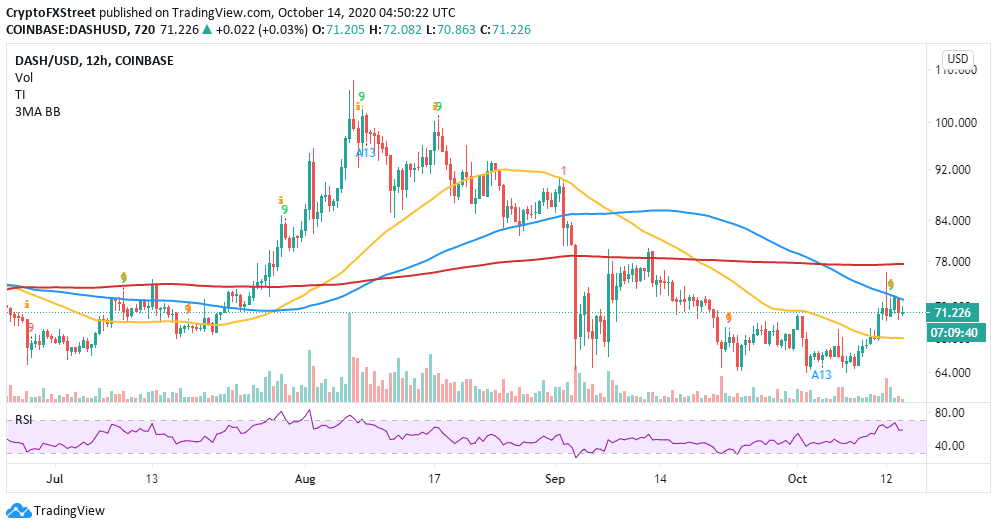
Dash recently embarked on a recovery mission after appearing to have bottomed out at $65. Before the recovery, a lower high pattern from August’s peak of $105 kept recovery at bay. On the downside, the crypto tested support at $65 severally before the remarkable breakout in the first week of October.
Dash bearish narrative eyes $65
At the time of writing, Dash is teetering at $71 while holding firmly to support at $70. On the upside, the 50-day Simple Moving Average limits movement. On the other hand, the Relative Strength Index (RSI) gradual slope towards the midline suggests an intensifying bearish grip. As mentioned, $70 is immediate support. If broken, Dash could spiral to refresh levels at $65 beforehand.
DASH/USD daily chart
-637382506778531483.png)
The TD Sequential indicator adds credence to the bearish case after flashing a sell signal in the 12-hour timeframe. Besides $70, the 50 SMA is in line to absorb some of the developing selling pressure. The losses might continue, retesting the descending triangle support at $65. Furthermore, the RSI in the same range is pointing south after rejection from the overbought area.
DASH/USD 12-hour chart
IntoTheBlock’s IOMAP model reveals impenetrable zones towards $80. It is doubtful that Dash will continue with the uptrend in the near term. Nonetheless, the most robust resistance lies between $72.6 and $74. Here, just about 46,000 addresses previously purchased approximately 451,000 DASH.
On the flip side, the weakening support shows that the path of least resistance is downwards. However, the strongest of these anchor zones run from $65.6 to $67. Previously, almost 43,000 addresses purchased roughly 252,000 DASH.
Dash IOMAP chart
-637382507668085544.png)
Another on-chain metric by IntoTheBlock, the “Daily New Addresses” chart, shows impressive growth in the number of new addresses joining the Dash network. For instance, addresses soared from roughly 49,000 on October 8 to approximately 83,000 on October 13. It means that Dash the uptake of Dash is growing despite the retracement from $75. If this continues, higher liquidity and improving network growth will serve as a bullish indicator.
Dash new addresses chart
-637382508027019101.png)
Looking at the other side of the picture
It is worth mentioning that the TD Sequential indicator sell signal could also be invalidated if DASH/USD holds firmly to the support at $70. On the upside, price action above the 100 SMA in the 12-hour timeframe might open the door for gains towards $75 and $80, respectively. Consolidation beyond $70 will give buyers ample time to gather the strength needed to enact a reversal to higher levels.
Author

John Isige
FXStreet
John Isige is a seasoned cryptocurrency journalist and markets analyst committed to delivering high-quality, actionable insights tailored to traders, investors, and crypto enthusiasts. He enjoys deep dives into emerging Web3 tren


