Dash Price Analysis: DASH explodes after bouncing up from 50-day SMA
- Dash buyers took back control and made up for this Tuesday’s losses.
- DASH has previously faced rejections at the 200-day SMA.

After crossing the $100-barrier on August 7, DASH fell to $6.50 on September 23. Since then, the privacy coin has gone up to $75.50, as of writing. Dash had earlier jumped from $67.30 to $75 this Monday before facing rejection at the 200-day SMA ($76.30) and dropping to the 50-day SMA ($70.50) the next day. After regaining control, the buyers were able to make up for Tuesday's losses by jumping the price up to $75.50.
DASH/USD daily chart
-637389189643670490.png)
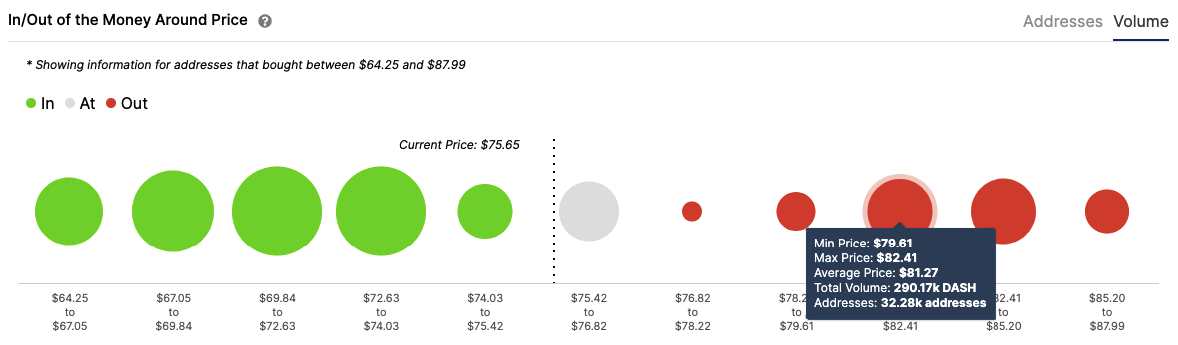
The MACD shows increasing bullish momentum. The buyers should be able to break above the 100-day and 200-day SMAs. As per IntoTheBlock’s In/Out of the Money Around Price (IOMAP), there is a moderate resistance level at $80. Previously, 32,280 addresses had purchased 290,000 DASH tokens. Upon conquering this level, DASH should be able to touch the $90-zone.
DASH IOMAP
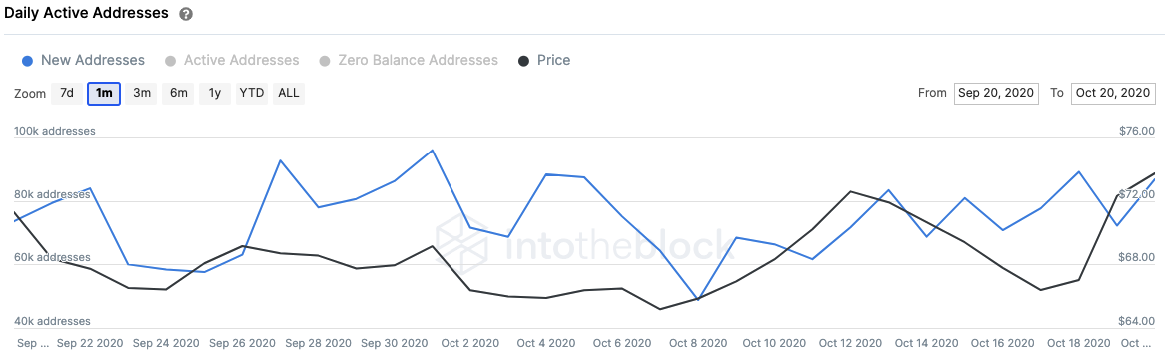
Adding further credence to the bullish outlook is the number of addresses entering the protocol. The number of new addresses entering over the last month reached a low of 48,800 addresses on October 8. It has since gone up to 86,820, as of writing. This is a strong signal as it is indicative of a healthy network.
DASH New Addresses
The Flipside: Can the bears take back control?
The sellers can change this bearish outlook by ensuring that the 200-day SMA doesn’t flip from resistance to support. If Dash fails to break above this level, it can drop down to $73. As per the IOMAP, there are healthy support walls at $73, 50-day SMA ($70.50) and $68, which should absorb a considerable amount of selling pressure.
Key price levels to watch
The buyers' key levels are the 200-day SMA ($76.30) and 100-day SMA ($77.50). They will need to break above them and aim for the $80 barrier.
On the other hand, the bears are severely limited by three strong support walls at $73, 50-day SMA ($70.50) and $68.
Author

Rajarshi Mitra
Independent Analyst
Rajarshi entered the blockchain space in 2016. He is a blockchain researcher who has worked for Blockgeeks and has done research work for several ICOs. He gets regularly invited to give talks on the blockchain technology and cryptocurrencies.



