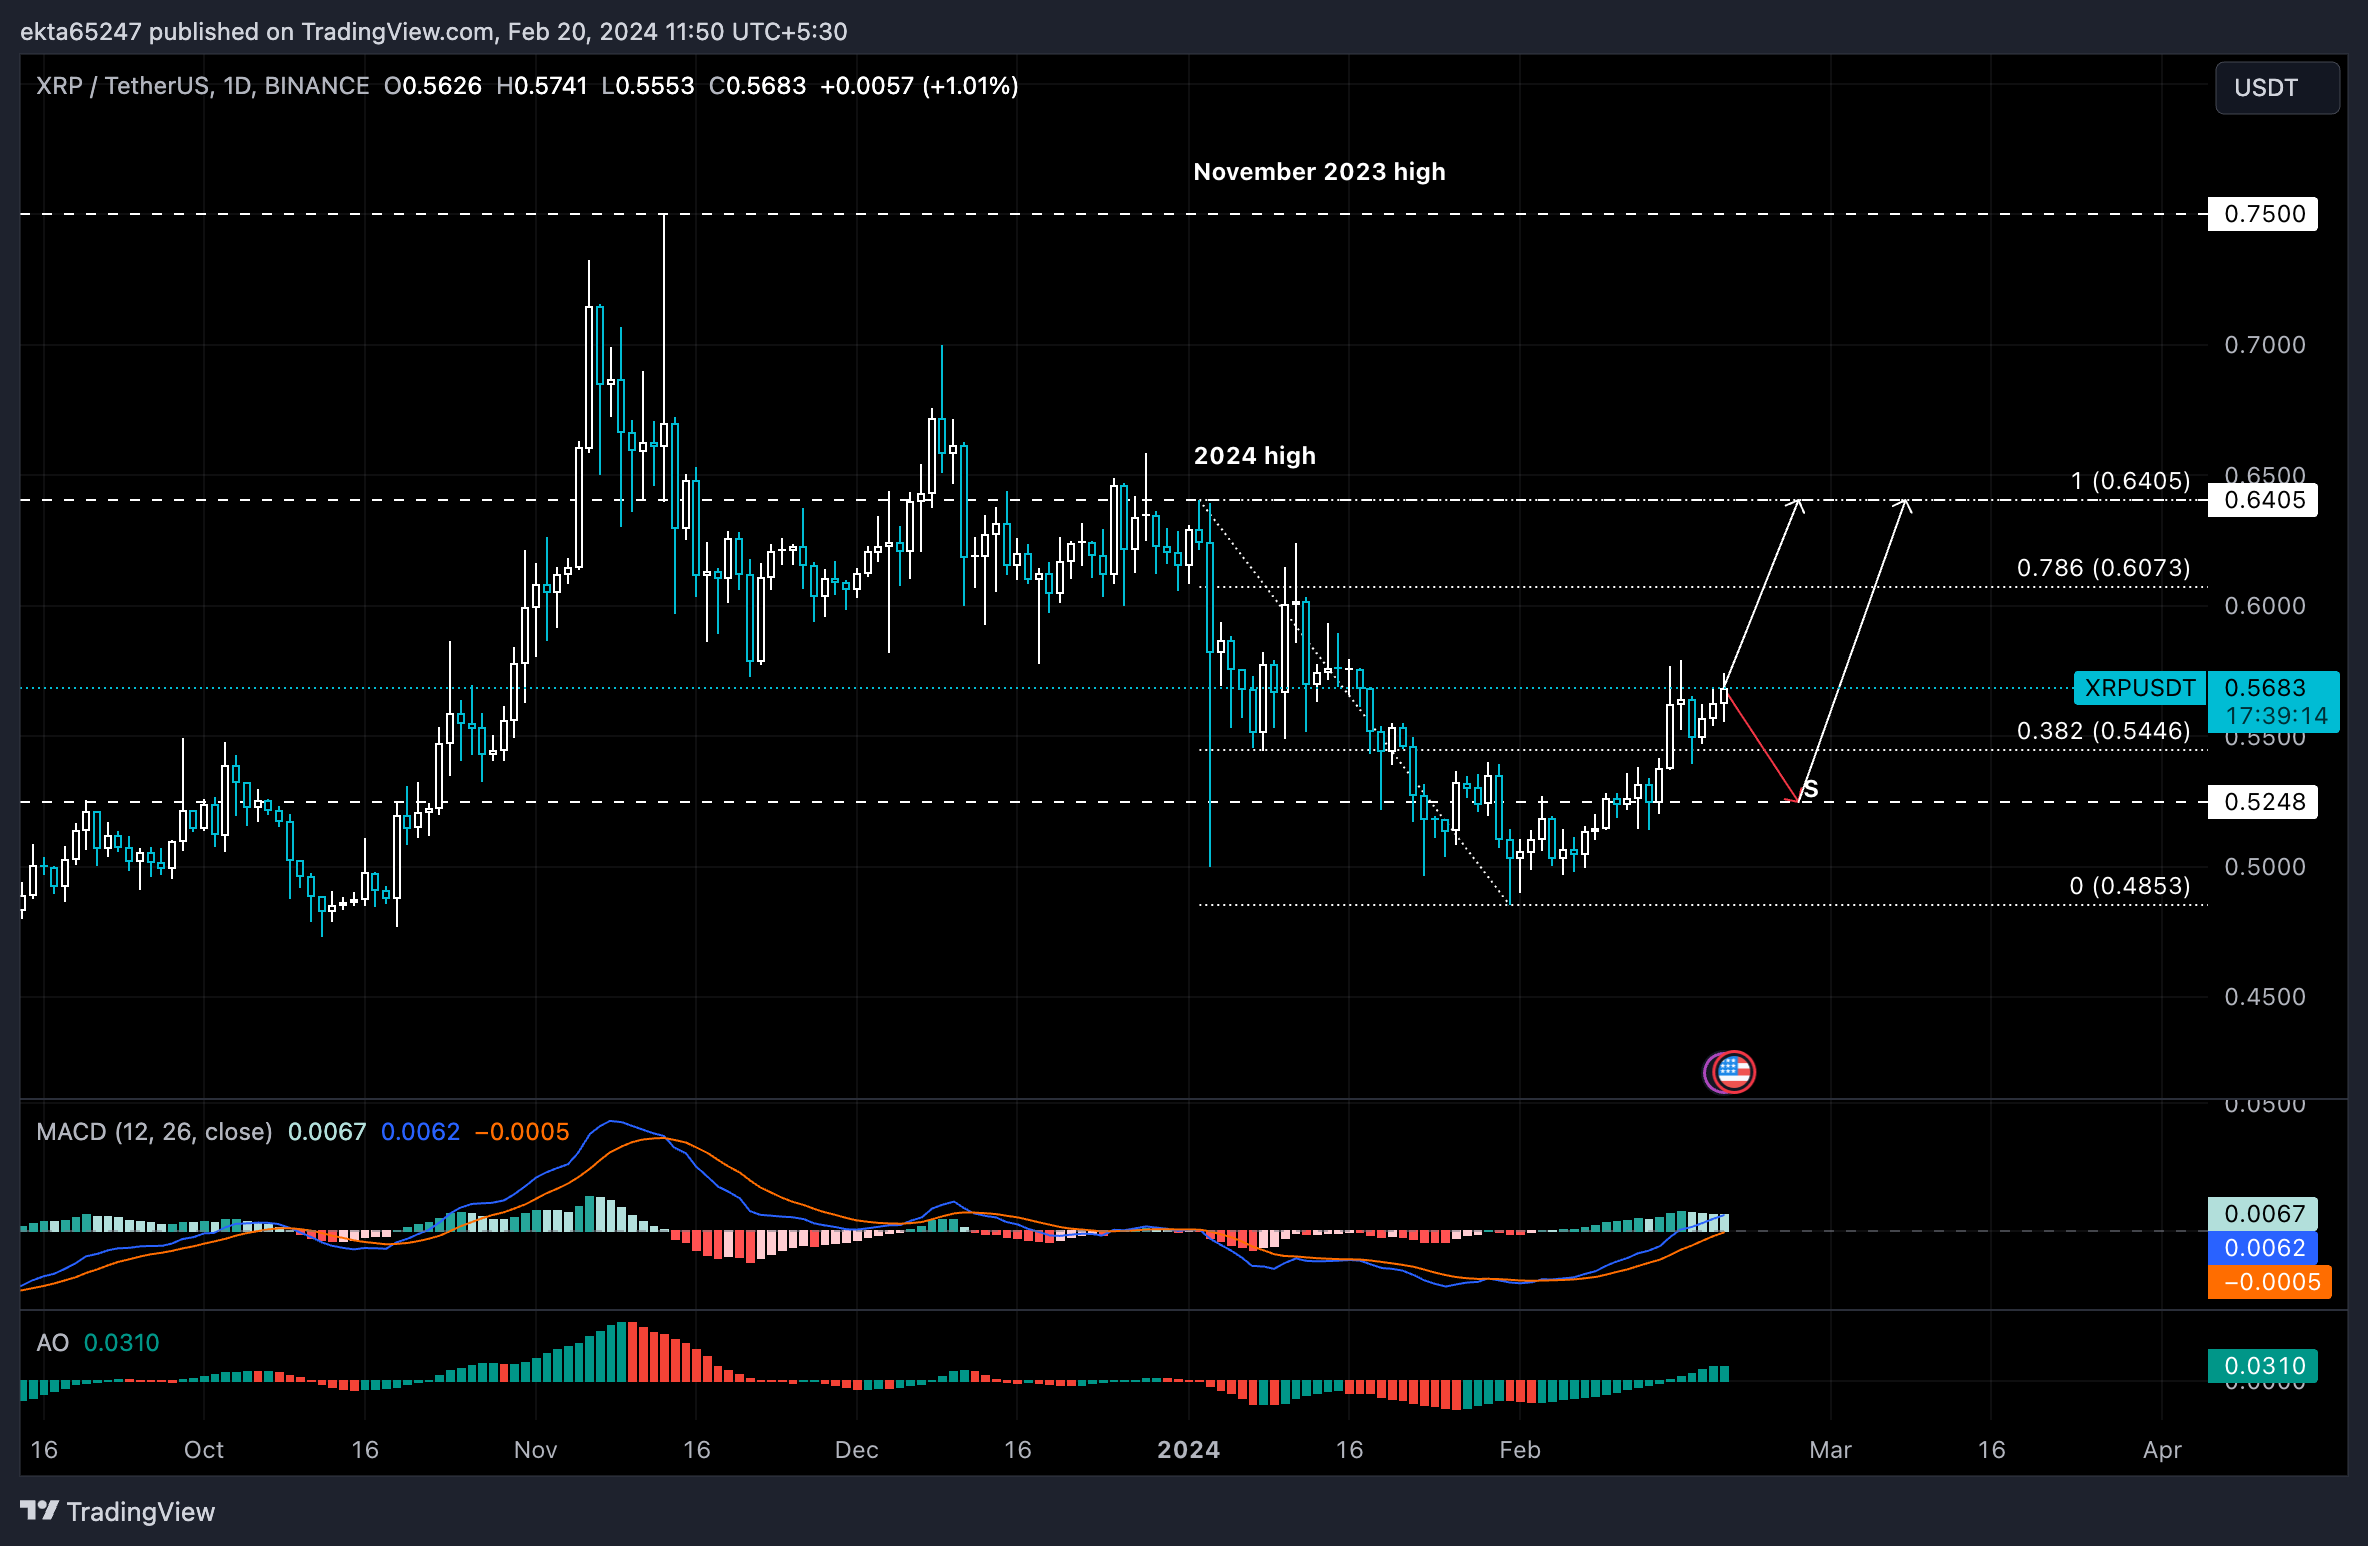
XRP price eyes rally to 2024 peak, holders await new developments in SEC v. Ripple lawsuit
XRP price climbs to a high of $0.5741 on Tuesday, rallying towards its $0.60 target. The altcoin is in an uptrend, as the SEC v. Ripple lawsuit enters a new phase in its legal battle, known as "remedies". The remedies phase could result in a declaratory judgment on the issue before the court, damadges being awarded and or sanctions being imposed.
In Judge Torres' original ruling, Ripple was in violation of securities law only in sales to instiutional clients, not to retail investors, and it is still possible new evidence from the financial statements and institutional sales contracts shared by Ripple, could come to light and influence the outcome of the SEC v. Ripple lawsuit.
Altcoins facing a risk of correction after massive rally: Cardano, Chiliz, Fetch.AI, Lido, The Graph
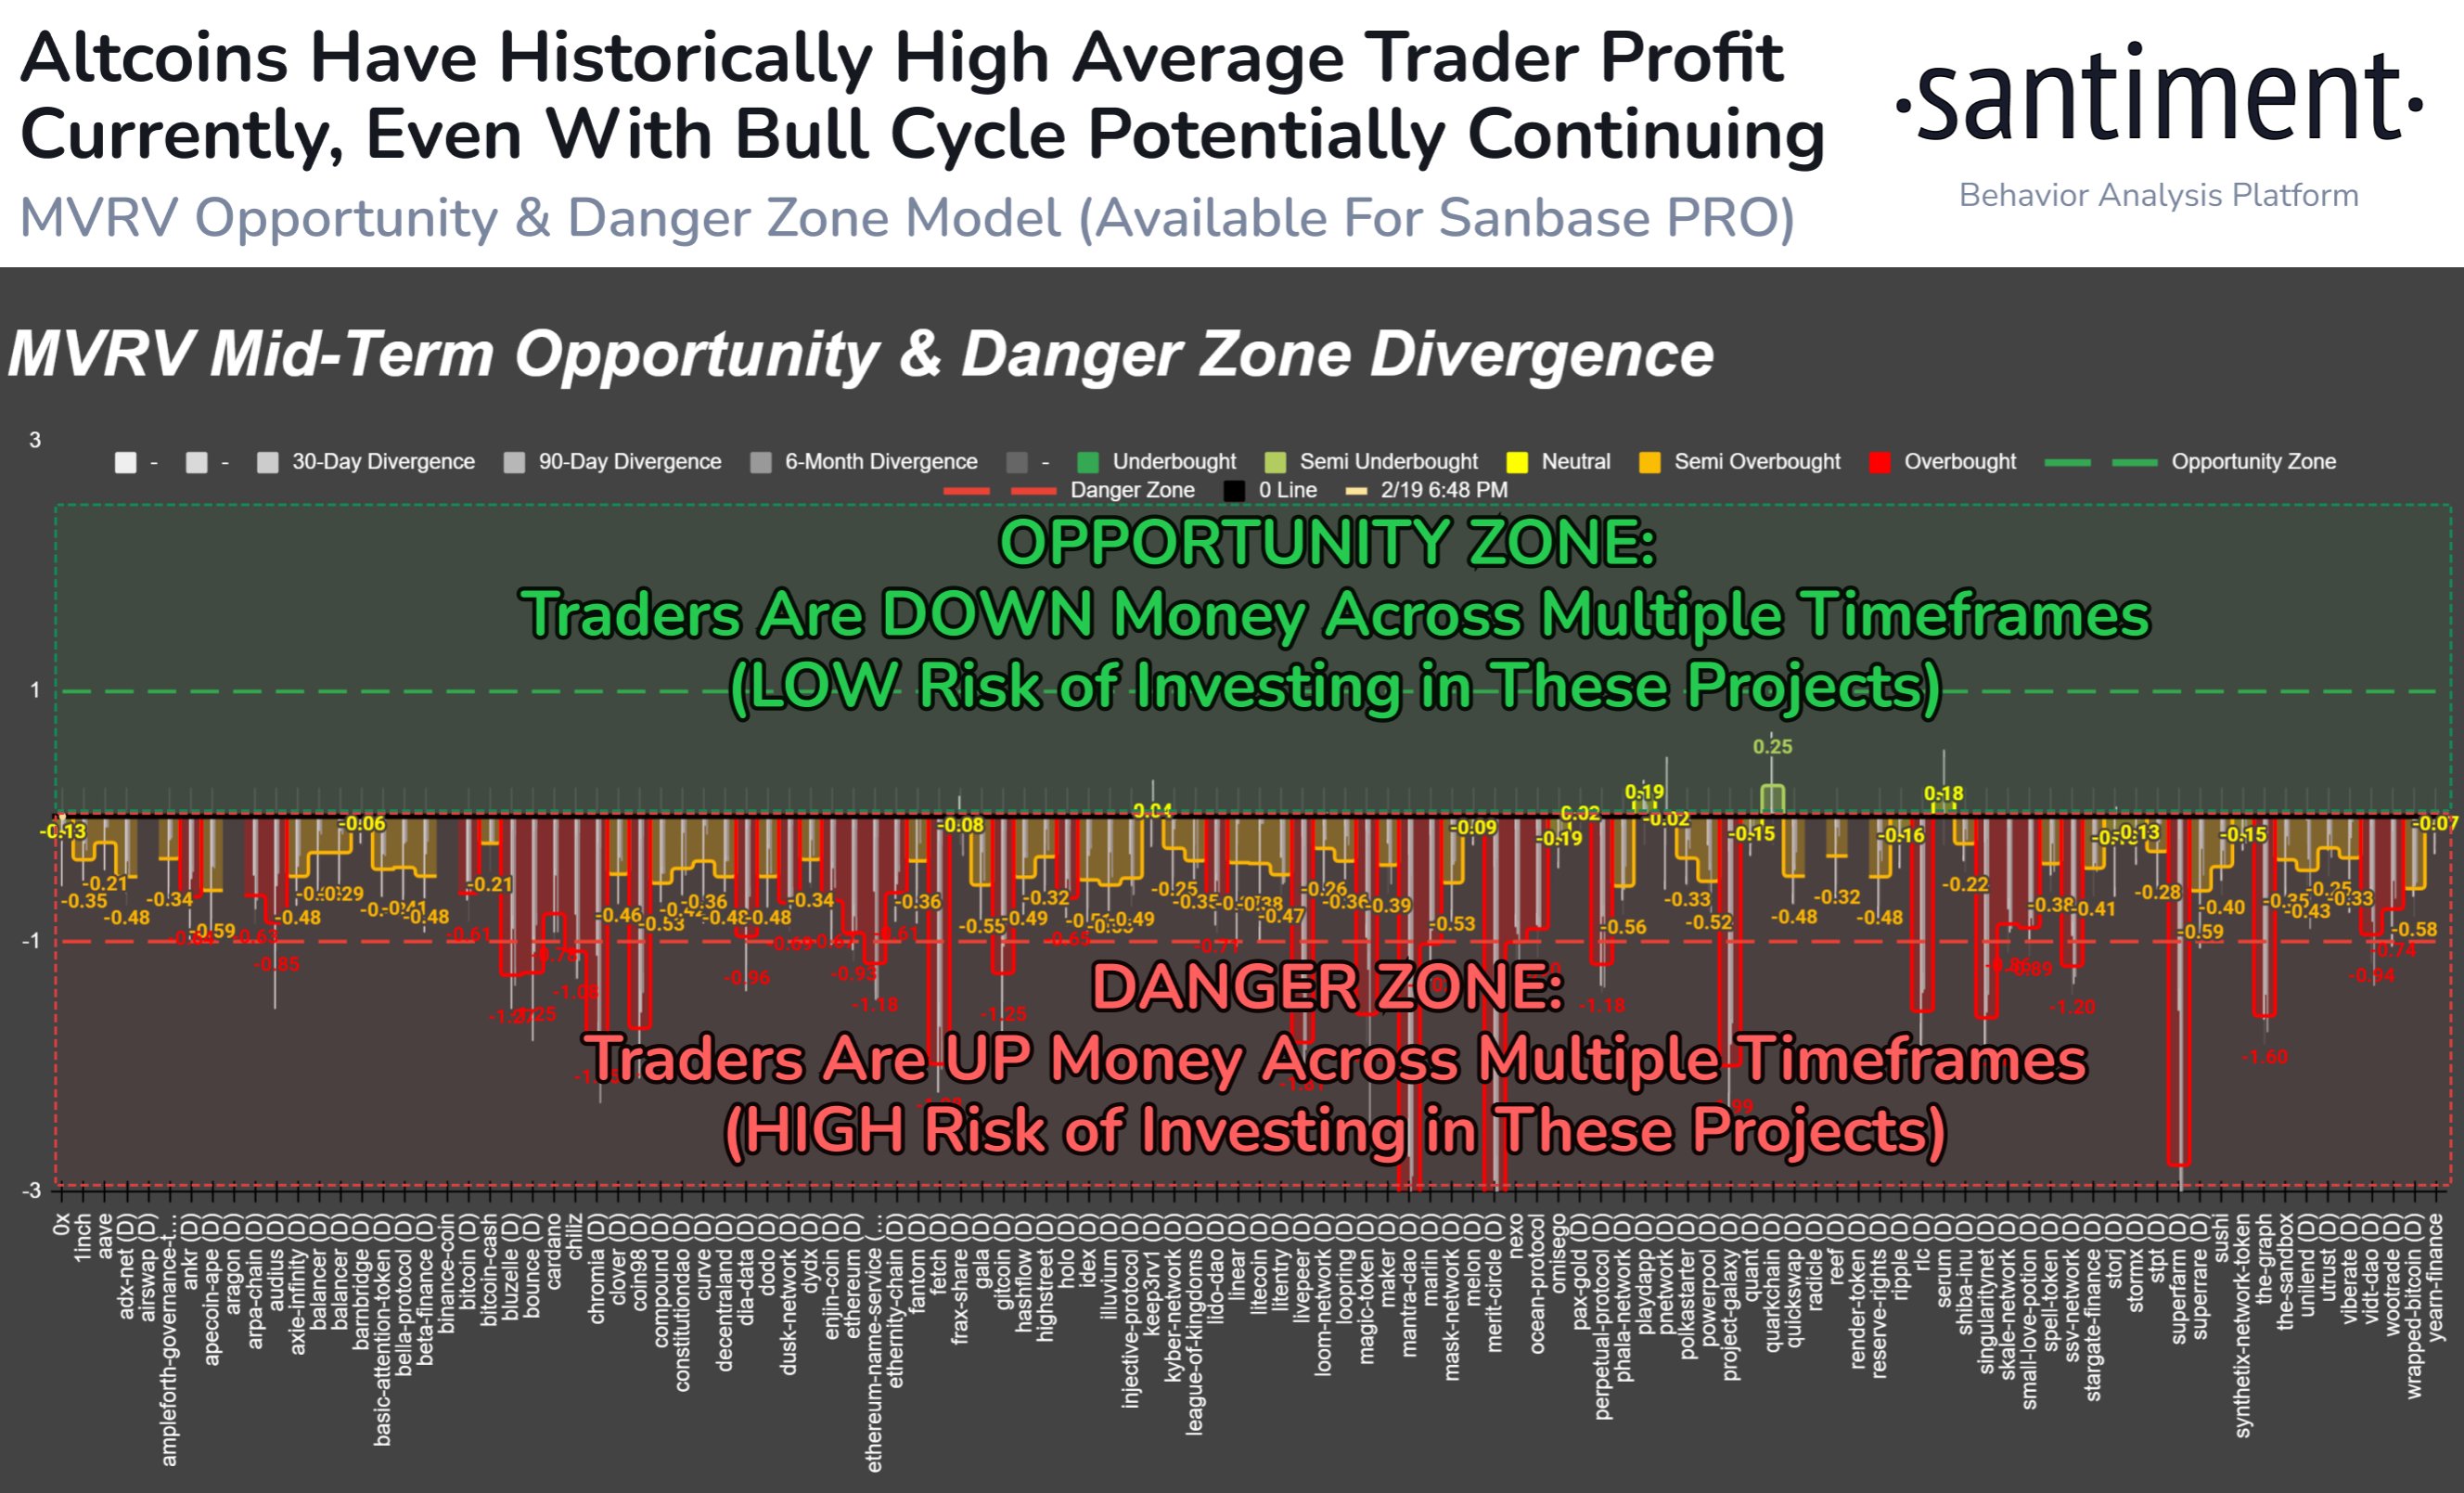
Altcoin prices have climbed in the past four months, offering massive gains to holders beginning October 2023. Except for a few lagging altcoins, a vast majority of assets generated profits for average wallet holders in the mid to long term timescale.
Crypto intelligence tracker Santiment’s predictive model uses Market Value to Realized Value (MVRV) metric to determine whether an altcoin is in an opportunity or danger zone. The model identified several assets in the danger zone, most notable ones including Cardano, Ethereum, Lido and Fetch.AI, among others.
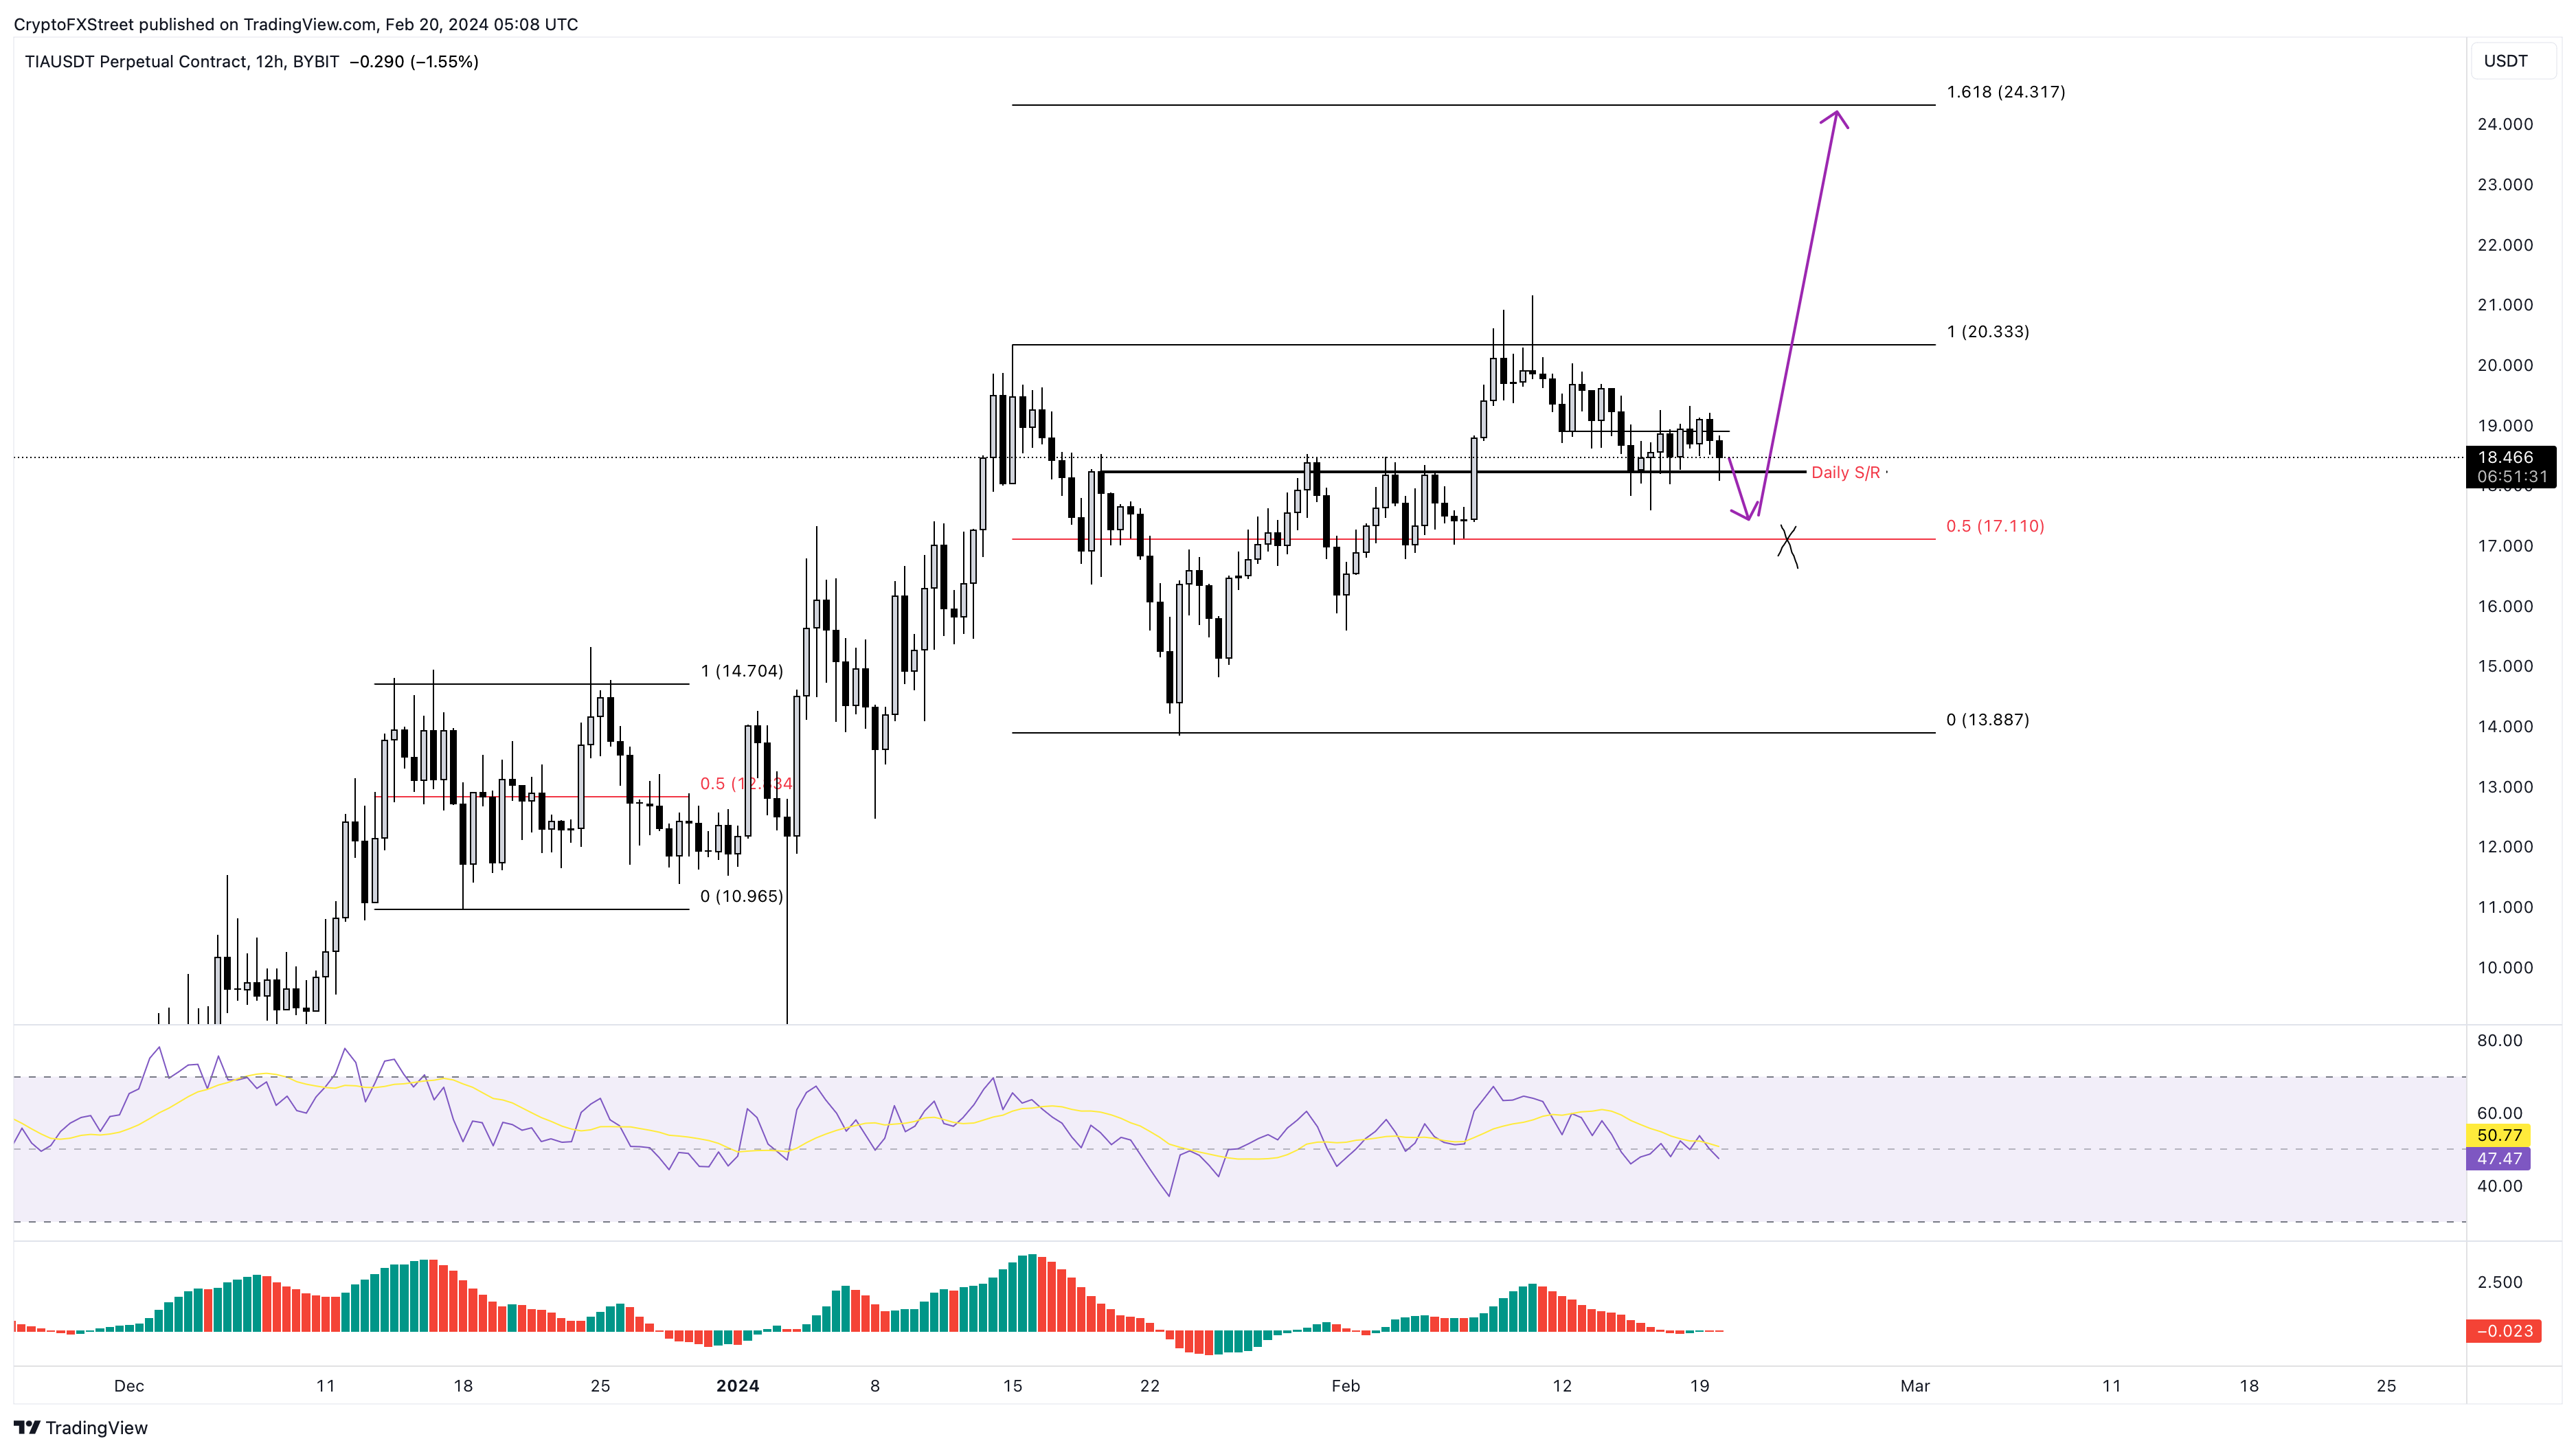
Celestia price could dip before TIA rallies 40%
Celestia (TIA) price shows signs that it is closer to triggering a rally. But there might be a dip before the TIA bulls kickstart an explosive move to the upside. Celestia price action between January 15 and February 20 has resulted in a $13.88 to $20.33 range. Recently, however, TIA has been moving sideways above the daily support level at $18.23. Investors can expect the altcoin to sweep the range’s midpoint at $17.11, which could be a buying opportunity for sidelined buyers.
The Awesome Oscillator (AO) has already flipped negative and is hovering close to the zero level, indicating a struggle between the bulls and the bears. The Relative Strength Index (RSI) also shows a similar, though uncertain, outlook; both indicators support a potential correction if it occurs.
Information on these pages contains forward-looking statements that involve risks and uncertainties. Markets and instruments profiled on this page are for informational purposes only and should not in any way come across as a recommendation to buy or sell in these assets. You should do your own thorough research before making any investment decisions. FXStreet does not in any way guarantee that this information is free from mistakes, errors, or material misstatements. It also does not guarantee that this information is of a timely nature. Investing in Open Markets involves a great deal of risk, including the loss of all or a portion of your investment, as well as emotional distress. All risks, losses and costs associated with investing, including total loss of principal, are your responsibility. The views and opinions expressed in this article are those of the authors and do not necessarily reflect the official policy or position of FXStreet nor its advertisers. The author will not be held responsible for information that is found at the end of links posted on this page.
If not otherwise explicitly mentioned in the body of the article, at the time of writing, the author has no position in any stock mentioned in this article and no business relationship with any company mentioned. The author has not received compensation for writing this article, other than from FXStreet.
FXStreet and the author do not provide personalized recommendations. The author makes no representations as to the accuracy, completeness, or suitability of this information. FXStreet and the author will not be liable for any errors, omissions or any losses, injuries or damages arising from this information and its display or use. Errors and omissions excepted.
The author and FXStreet are not registered investment advisors and nothing in this article is intended to be investment advice.
Recommended Content
Editors’ Picks
Could Worldcoin price shoot up 45% ahead of OpenAI’s live stream on Monday?
Worldcoin has formed a double bottom around a key support level, suggesting a potential accumulation. If the OpenAI’s Monday live stream has a positive impact on Artificial Intelligence field, it could positively impact WLD and other AI-based tokens.
Here’s what needs to happen for The Graph price to revisit $0.422

The Graph price trades inside the $0.192 to $0.494 range. Investors need to wait for GRT to overcome $0.343 before being bullish on GRT. If successful, GRT could rally 50% and revisit the $0.422 hurdle. A decisive daily candlestick close below $0.192 will invalidate the bullish thesis.
SingularityNET price could bounce 30% if AGIX can hold this level

SingularityNET price has been consolidating around the bottom of the $0.903 to $1.475 range for nearly a month. With some AI-tokens showing signs of revival, AGIX needs to be enalyzed for potential breakout opportunities like Arkham (ARKM).
Arkham price primed for a recovery rally ahead of OpenAI’s announcement

Arkham price eyes a potential reversal as it clears key hurdles. ARKM likely to rally 27% if it can overcome $2.74 resistance level. A breakdown of $2.28 wil invalidate the bullish thesis for the AI-based token.
Bitcoin: Why BTC is close to a bottom

Bitcoin (BTC) price efforts of a recovery this week have been countered by selling pressure during the onset of the American session. However, the downside potential appears to have been capped.