Compound Technical Analysis: COMP rejected at $160, sell signals threaten freefall to $140
- Compound bullish outlook is thrown out the window following a barrier at $160.
- A dwindling network growth validates the bearish narrative; thus, the losses could extend under the 50 SMA.

Compound recently resumed an uptrend within an ascending parallel channel. The recovery was necessitated by the drop from the high reached in December at $180. However, COMP hit a barrier at $160, thus the struggle to sustain the gains.
Selling pressure intensifies as declines to $140 beckon
Compound is exchanging hands at $154 at the time of writing. As mentioned, the price is dancing within an ascending parallel channel. In conjunction with the seller congestion at $160, the middle boundary has capped upward price movement.
On the downside, the token is immediately supported by the channel's lower boundary and aided by the 50 Simple Moving Average. If these two key support levels are shattered, Compound will likely slump to the anchor zone highlighted at $141 by the 100 SMA. The 200 SMA currently holds the ground at $130 and will come in handy if the buyer congestion at $140 is shattered.
A bearish divergence of the Relative Strength Index from the token's price has also been spotted on the 4-hour chart. The divergence forms when the price creates a series of higher lows while the RSI forms lower highs. This situation suggests that volume is decreasing and bulls are losing traction while sellers prepare to regain control.
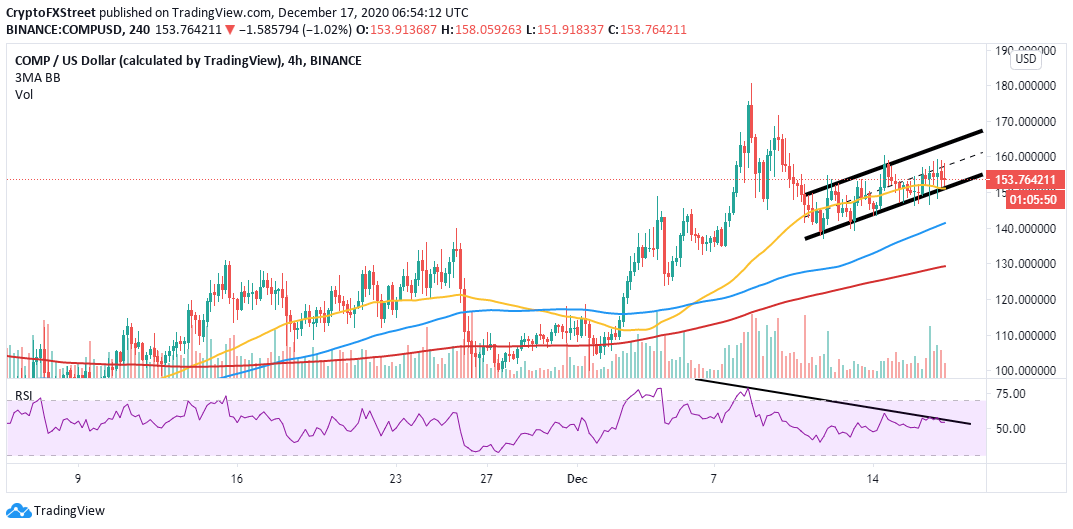
COMP/USD 4-hour chart
The TD Sequential indicator recently presented a sell signal on the 12-hour chart, which adds credibility to the glum outlook. The bearish formation was established as a green nine candlestick anticipating a one to four candlesticks correction.
A red two candlestick trading below a preceding red one candle could serve as confirmation that Cardano is likely to drop to lower price levels.
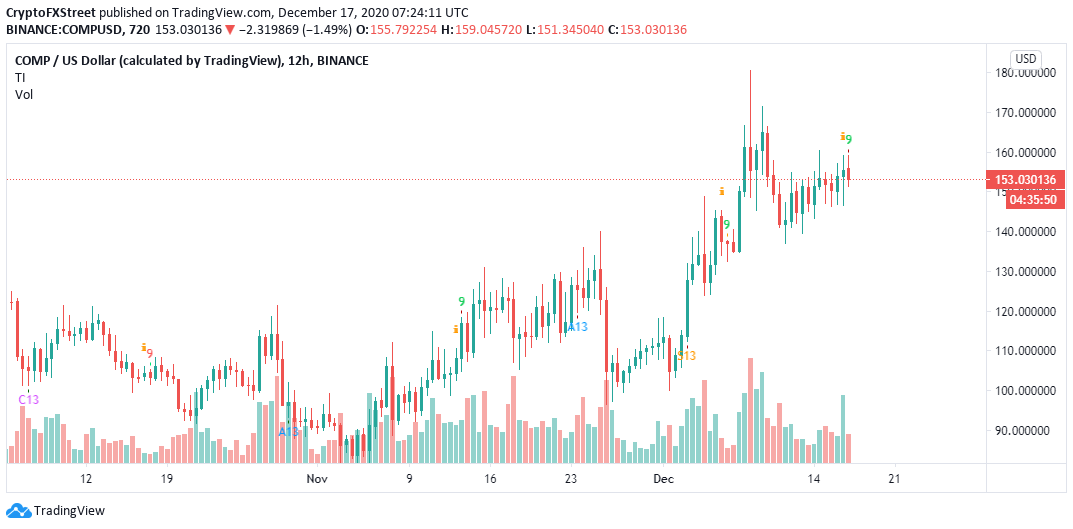
COMP/USD 12-hour chart
IntoTheBlock's "Daily New Addresses" model shows a significant drop in the number of new addresses joining the network over the last 48 hours. On December 13, about 6,400 addresses were created on Compound network, but that number went down to roughly 3,400 by December 16, representing nearly a 50% drop.
A decrease in network growth is a bearish signal for both the asset and the network as it affects its adoption. Moreover, the inflow and outflow of tokens on the platform are usually greatly affected.
-637437868216619490.png)
Compound new addresses chart
On the upside, the bearish outlook will be thrown out the window if Compound breaks above the channel's middle boundary. The resistance at $160 must give way for gains to $170 and $180 as well. If push were to come to shove, the demand at the 50 SMA on the 4-hour should hold to avert the losses eyeing $140.
Author

John Isige
FXStreet
John Isige is a seasoned cryptocurrency journalist and markets analyst committed to delivering high-quality, actionable insights tailored to traders, investors, and crypto enthusiasts. He enjoys deep dives into emerging Web3 tren



