Compound Price Forecast: COMP prepares for a 13% breakdown amid overbought conditions
- Compound's uptrend hits the stubborn resistance at $140 as declines linger.
- A sell signal on the 4-hour chart adds credence to the bearish outlook.

Compound rallied 13% in the last 24 hours despite the stability that has prevailed in the market since mid this week. The decentralized finance (DeFi) token has also grown by 38% since December 1. However, a correction seems imminent, especially after encountering acute resistance at $140.
Compound correction could extend to $115
COMP is dancing at $137 at the time of writing. Its immediate upside is likely to be limited by the seller congestion at $140. In November, Compound rallied massively but failed to overcome this same hurdle. Therefore, another correction is likely to come into the picture, mainly due to the overbought condition.
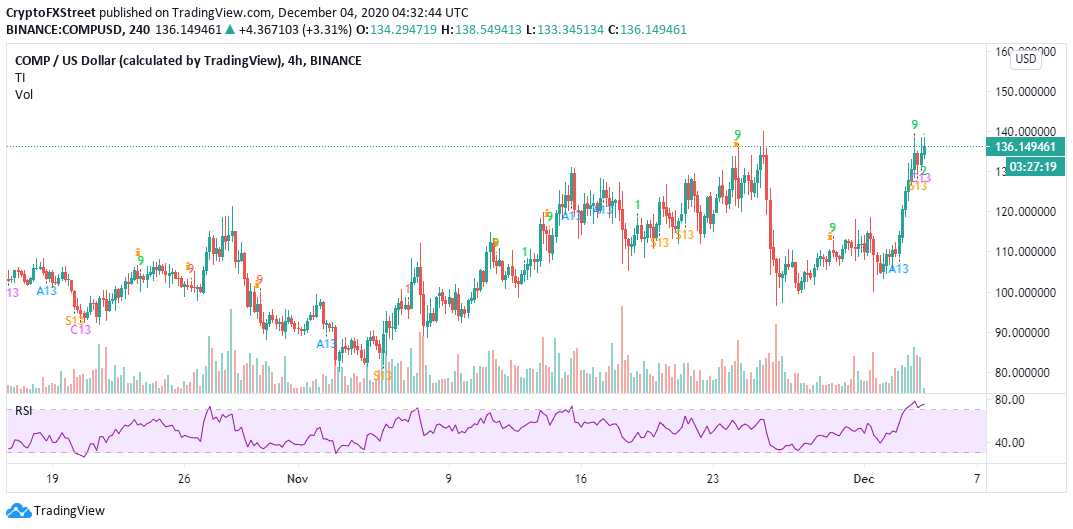
The Relative Strength Index has been held within the overbought area since Thursday. However, it is essential to realize that usually, the RSI corrects when an asset is overbought. Therefore, COMP/USD might embark on a gains-trimming exercise. The correction will be validated if the DeFi asset fails to break above $140.
-637426536223597978.png)
COMP/USD 4-hour chart
On the downside, the first formidable support has been highlighted by the 50 Simple Moving Average at $115 on the 4-hour chart. If the selling pressure intensifies, the 100 SMA and the 200 SMA will come in handy to protect Compound from falling to $100.
The TD Sequential indicator recently presented a sell signal on the same 4-hour chart. The signal manifested in a green nine candlestick. The previous call to sell was validated and resulted in massive losses as Compound refreshed levels slightly under $100.
If the current sell signal is confirmed, COMP might fall in one to four daily candlesticks. An increase in Compound supply might force an extended bearish leg, hence endorsing the potential fall to $115.
COMP/USD 4-hour chart
Santiment's network growth metric shows that Compound experienced a massive slump in the number of new addresses joining the network. At the beginning of December, the addresses topped 2,900 but dropped to roughly 1,980 by December 3.
If the network growth fails to recover, Compound will validate the breakdown. A decrease in network growth also highlights slow adoption and interruption of the platform's inflow and outflow of tokens.
%20[07.28.54,%2004%20Dec,%202020]-637426536385505118.png)
Compound network growth chart
It is worth noting that COMP will continue with the uptrend if the price slices through the primary resistance at $140. Trading above this crucial level is likely to catapult the DeFi token above $150 as investors rush to capitalize on the expected bull run.
Author

John Isige
FXStreet
John Isige is a seasoned cryptocurrency journalist and markets analyst committed to delivering high-quality, actionable insights tailored to traders, investors, and crypto enthusiasts. He enjoys deep dives into emerging Web3 tren


