Compound Price Prediction: COMP bears losing grip amid an improving technical outlook
- Compound is prime for a breakout towards $110 considering the various positive technical indexes.
- On-chain metrics suggest that recovery is unlikely in the near term, with COMP likely to settle for consolidation.

Compound has remained in the bears' hands amid the selloff in the decentralized finance (DeFi) sector. From the all-time high of $277, COMP/USD plunged by over 66% before finding some semblance of stability around $80. Meanwhile, a recovery seems to have come into the picture, with the token changing at $91 and targeting $110 on the upside.
Compound on the verge of a massive breakout
The 3-day chart illustrates the formation of a descending wedge pattern. A wedge is formed by converging trendlines that connect their respective highs and lows. An extended downtrend leads to the shape of a falling wedge – look at the chart below.
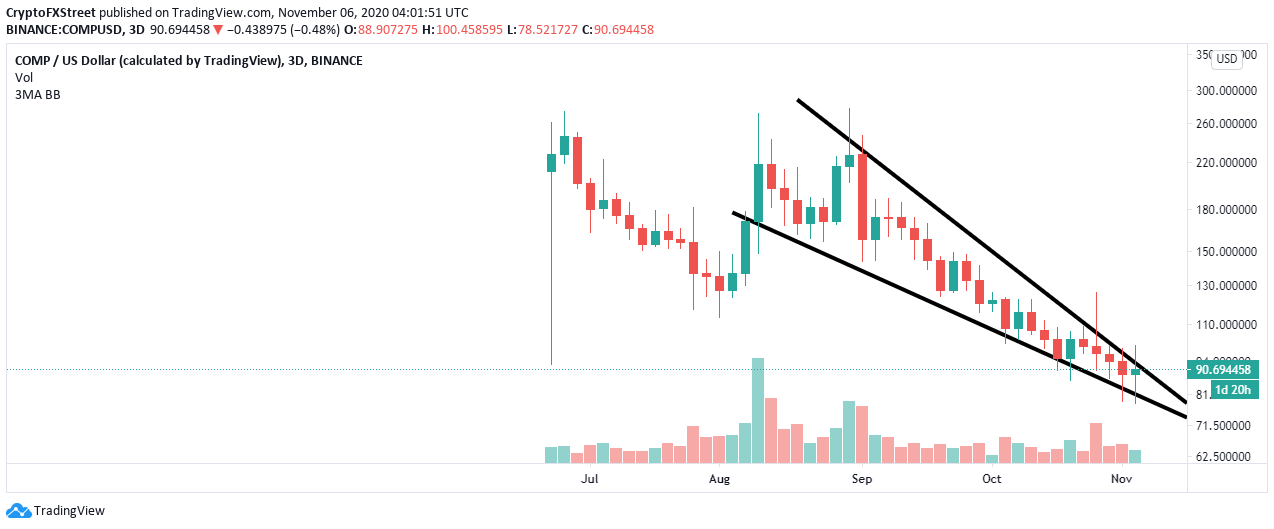
COMP/USD 3-day chart
Usually, buyers come in to slow down the momentum of the downtrend before the trendlines converge. Traders mostly watch out for instances when the price breaks above the upper trendline. The aim is to capitalize on the reversal above the wedge. Consequently, Compound is on the verge of a breakout, with a potential spike to $110.
The TD Sequential Indicator has presented a buy signal on the daily chart in the form of a red nine candlestick. It is not the first time Compound is getting a buy signal amid its extended downtrend. The chart shows three previous buy signals that have been invalidated.
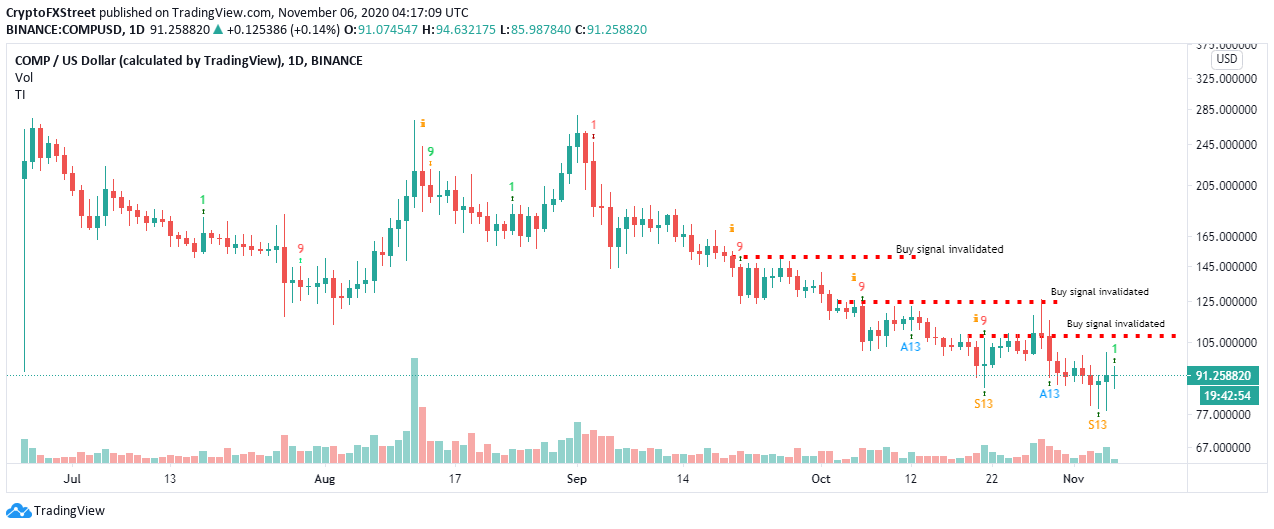
COMP/USD daily chart
However, a Doji candlestick indicates indecisiveness in the market. In other words, there is still a chance for Compound to rally, building on the buy signal and the recently established support at $80. Besides, the wedge pattern suggests that a breakout is around the corner.
-637402360396626651.png)
COMP/USD 4-hour chart
Simultaneously, if COMP closes the day above the 50 Simple Moving Average (SMA) on the 4-hour chart, the buy signal will be validated, while the odds will favor the resumption of the uptrend. On the upside, resistance expected at the 100 SMA and 200 SMA is likely to delay the breakout to $110. Additionally, the Moving Average Convergence Divergence illustrates the consistently growing influence from the bulls.
-637402363372689861.png)
Compound IOMAP chart
The IOMAP model by IntoTheBlock, reveals immense resistance ahead of COMP. In other words, the expected rally to $110 could be jeopardized by the intense selling pressure between $96 and $99. Here, 1,600 addresses previously purchased nearly 137,000 COMP.
On the downside, support is highlighted in the range running from $87.5 to $88.5. The enormous support comes from 845 addresses that previously purchased roughly 136,000 COMP in the range. It is worth noting that, Compound could settle for consolidation before a breakout comes into play.
Author

John Isige
FXStreet
John Isige is a seasoned cryptocurrency journalist and markets analyst committed to delivering high-quality, actionable insights tailored to traders, investors, and crypto enthusiasts. He enjoys deep dives into emerging Web3 tren


