Compound Price Analysis: COMP bulls are looking for a comeback, metrics suggest
- A recent report released by Santiment talks about the potential of COMP to bounce back up.
- COMP is currently trading at $128, around 60% lower than its peak at $329.

Compound is one of the most successful DeFi projects to enter the cryptocurrency market. After its listing on exchanges in June 2020, the price of COMP quickly jumped from a low of $66 to a high of $326. The digital asset got close to $1 billion in market capitalization and was almost immediately listed on the most popular exchanges, including Binance and Coinbase.
What does Santiment think about the future of COMP?
The rally to $326 didn’t last for too long. COMP is still trading 60% lower than its peak and was showing no signs of a comeback. However, according to a recent report by Santiment, a behavior analytics platform, several indicators are shifting in favor of the bulls.
COMP Exchange Inflow Chart
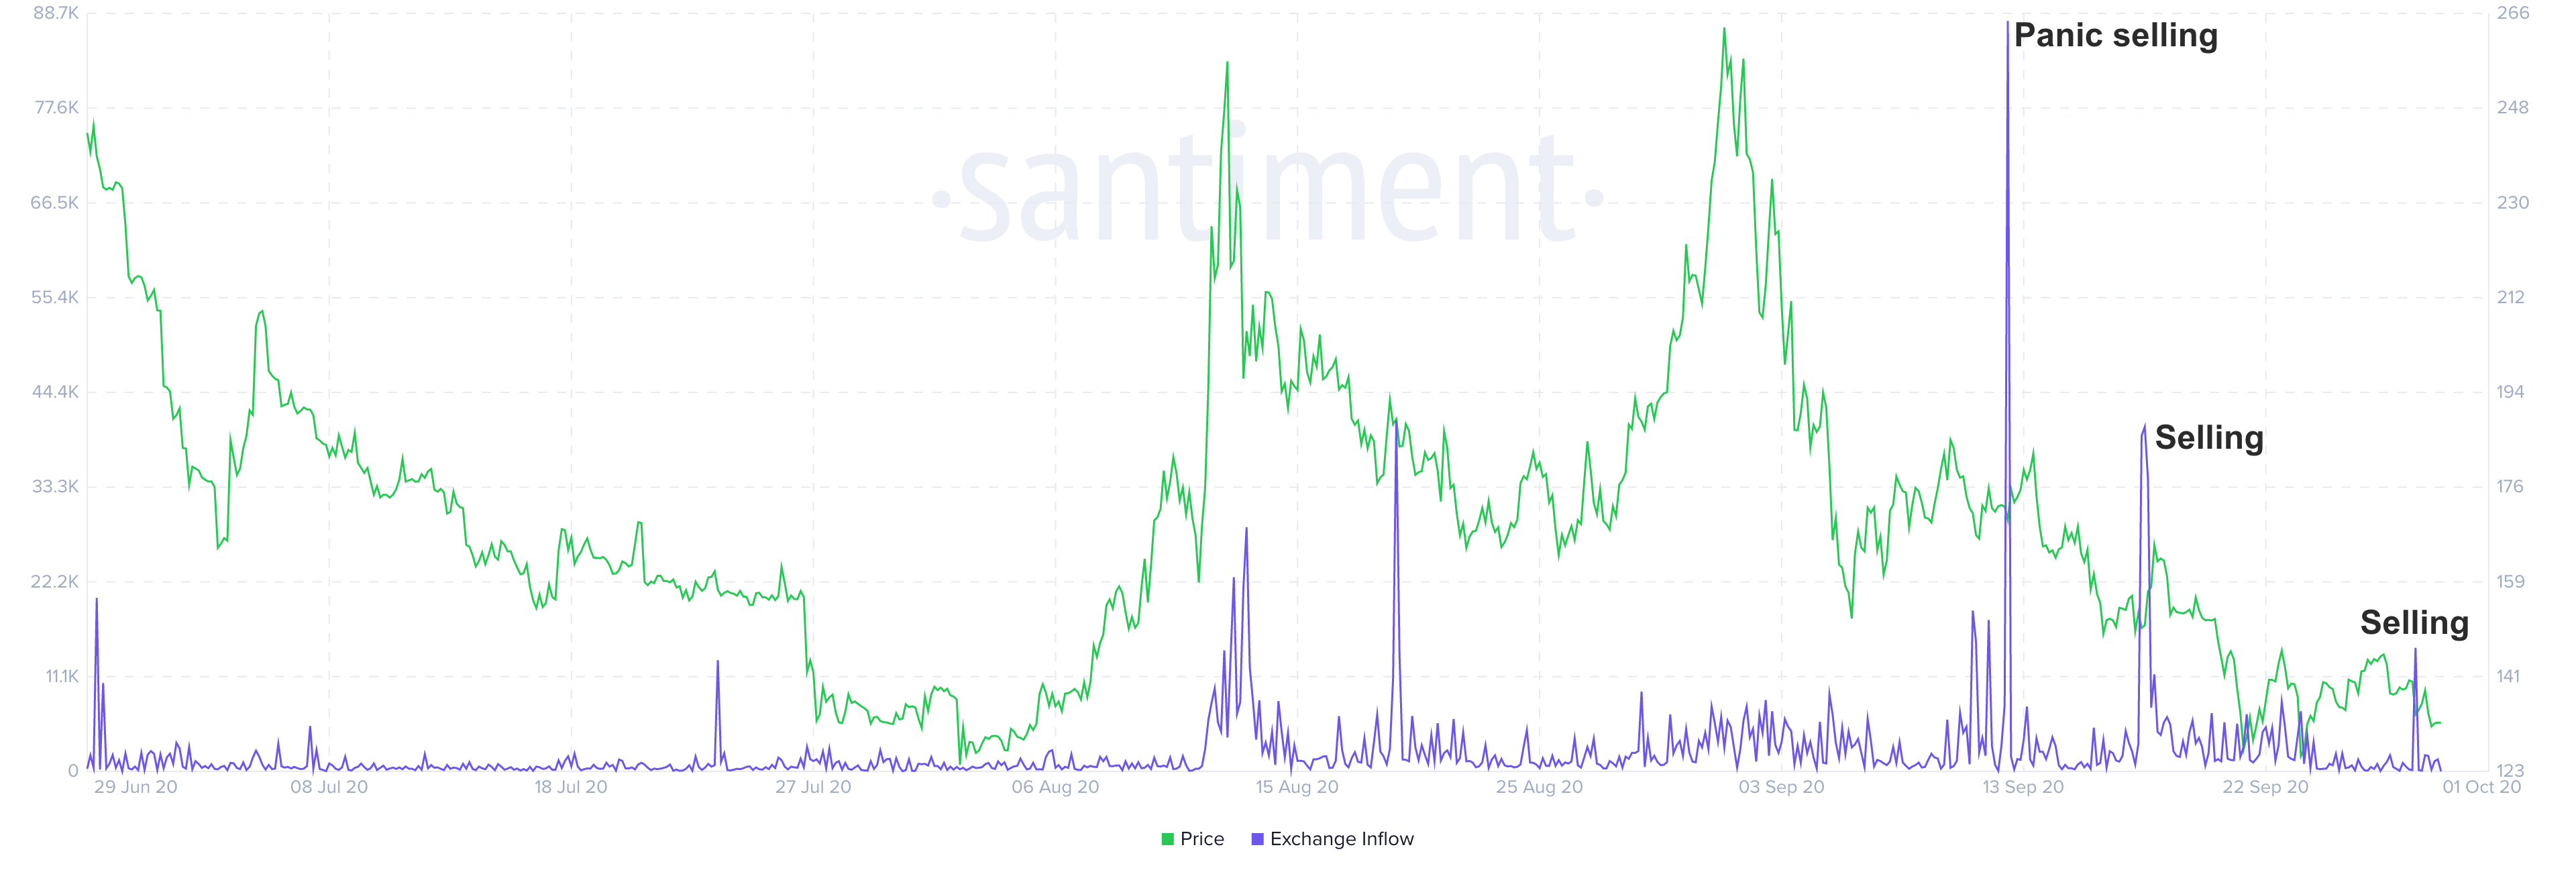
The report states that COMP has good on-chain activity, meaning the number of daily active addresses has remained flat, and it’s not declining, which is a healthy indicator. Another notable metric in favor of the bulls is the exchange inflow of COMP tokens. On September 13, the number of tokens going to exchanges spiked to around 90,000, while the price dropped 13% on the same day.
However, the next few spikes were far smaller, which indicates that bears are exhausted and a potential bottom could be forming.
COMP/USDT daily chart
-637369969677473044.png)
On the daily chart, bulls have established a critical support level at $128. The price of COMP has tested this level on several occasions since August, and bulls defended it every time. On August 3, the price of Compound bounced from this support level surging by more than 100% within the next week.
If history repeats itself and we see a similar price surge, COMP could very well re-test the high of $272. However, there is a resistance level closer in the form of the 50-SMA at $174. Additionally, the MACD is on the verge of turning bullish.
COMP/USDT 4-hour chart
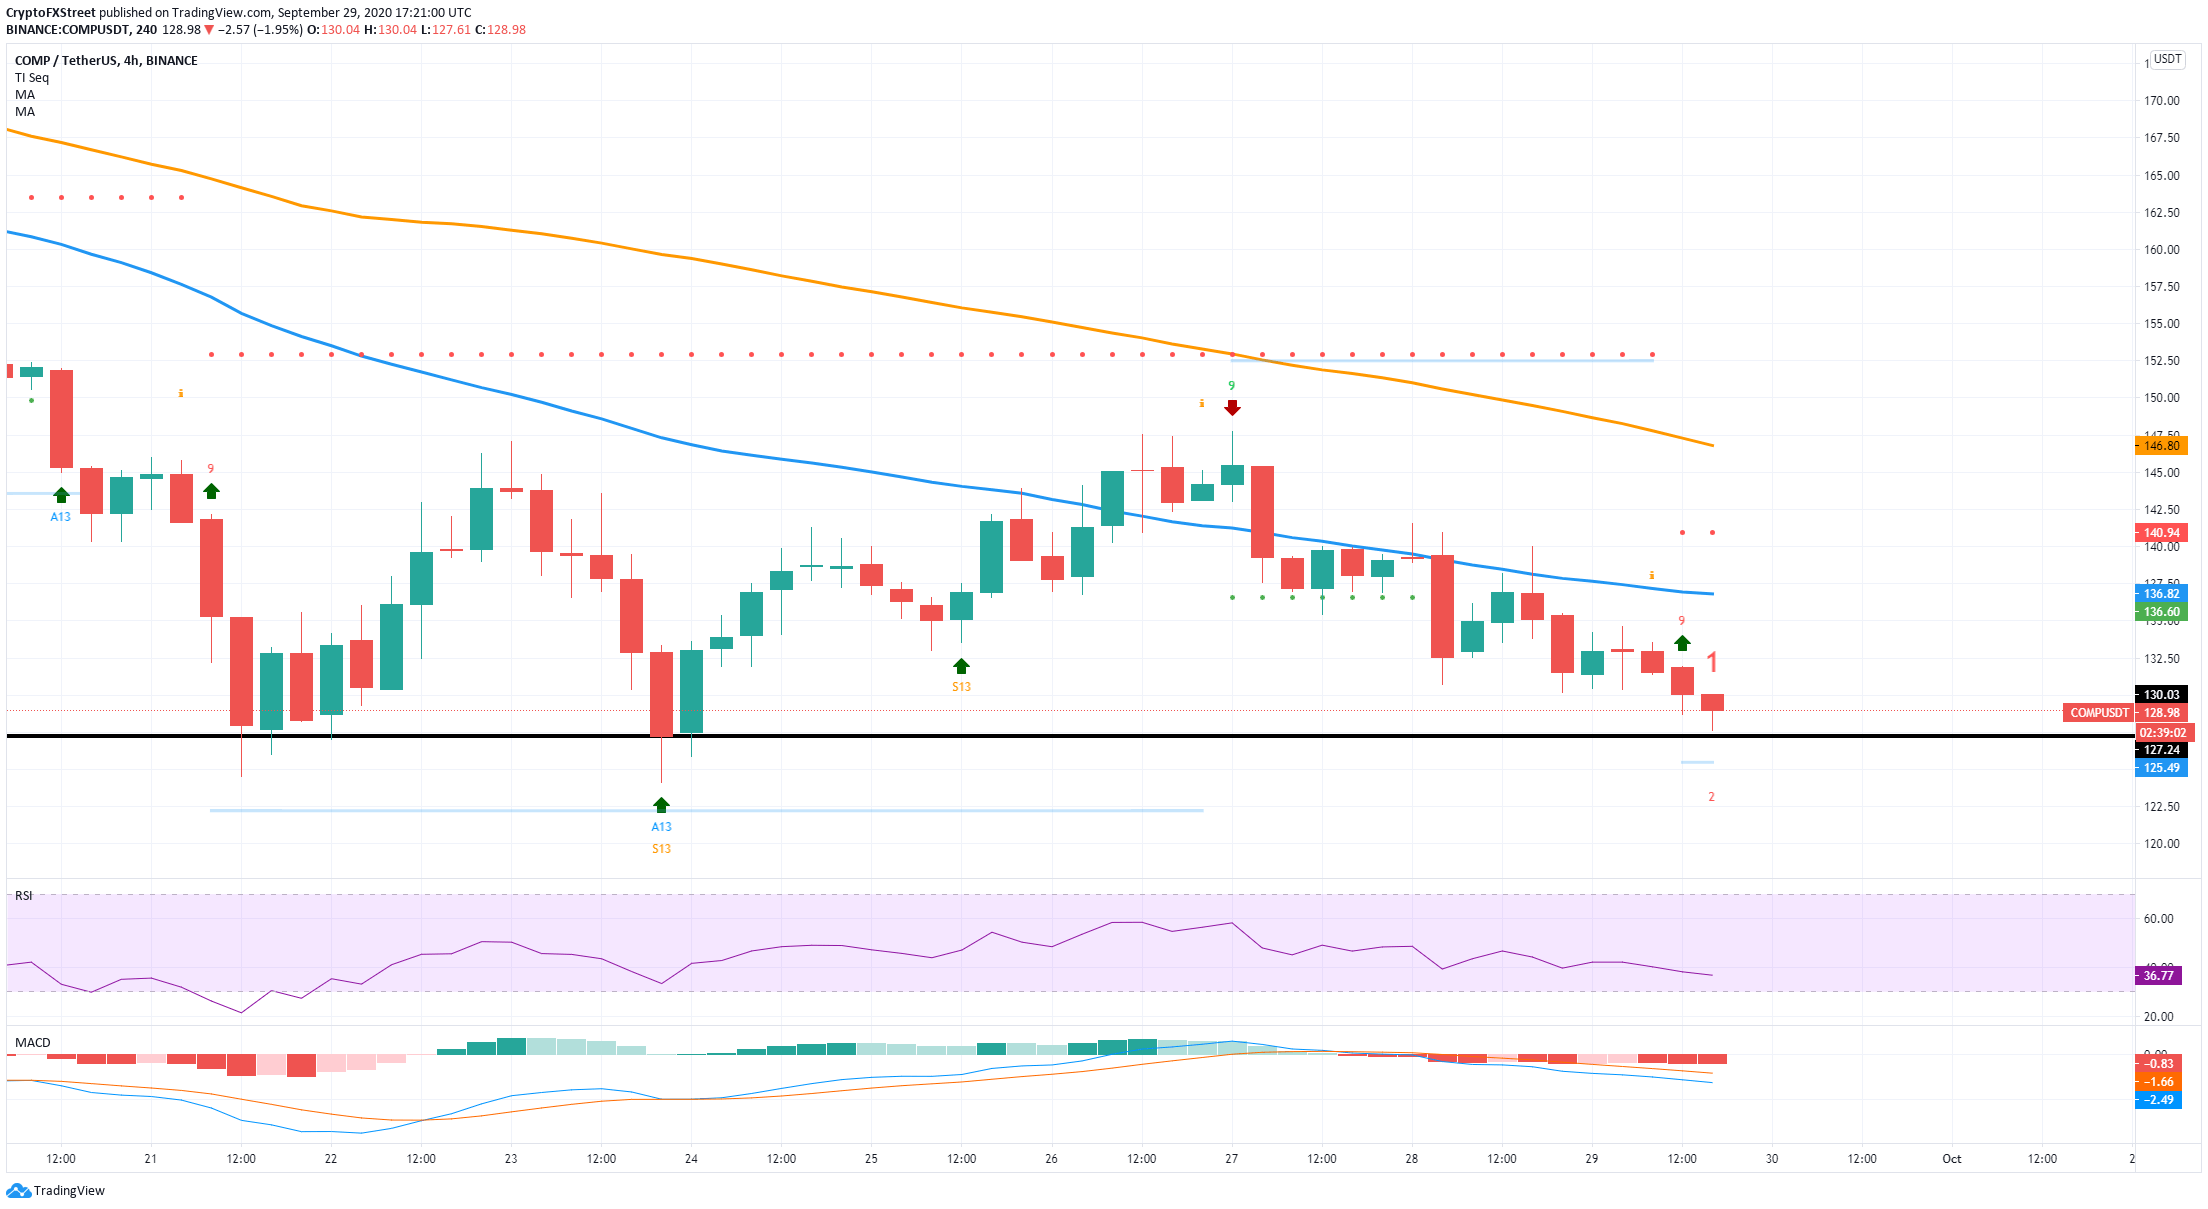
The TD sequential indicator has presented a buy signal in the form of a red ‘9’. A bounce from the $128 support level would validate this signal and take COMP up to at least the 50-SMA at $136.
On the other hand, as $128 is basically the lowest level COMP has ever traded at besides the first few days of trading, a bearish breakout below it would be devastating for the price. The lowest price point touched was $110 on August 2 on Binance. This level will probably serve as the next support pillar in case of a bearish breakout.
The $100 psychological level should also be considered a support level. At that point, the RSI will very likely be in oversold territory and will also act as support.
Author

Lorenzo Stroe
Independent Analyst
Lorenzo is an experienced Technical Analyst and Content Writer who has been working in the cryptocurrency industry since 2012. He also has a passion for trading.



