Chainlink trades at a discount as supply on exchanges continues to rise
- Chainlink is currently undervalued according to its MVRV ratio at -2.74%.
- The supply of LINK tokens across cryptocurrency exchanges continues climbing, increasing the selling pressure on Chainlink.
- Large wallet investors are scooping up LINK while the token trades at a discount.
-637336005550289133.jpg)
Chainlink, the web3 services platform, is currently undervalued with a negative Market Value to Realized Value (MVRV) ratio. There is a spike in selling pressure on the altcoin with increasing supply across exchanges.
Also read: XRP price rally gains momentum with massive spike in XRP Ledger activity
Chainlink is currently undervalued according to MVRV ratio
Market Value to Realized Value (MVRV) is the ratio between the market value of a crypto-asset and its realized value. This ratio is used to determine the tops and bottoms of Chainlink price.
Chainlink’s MVRV Ratio for the past thirty days -2.74%. MVRV score below one signals that an asset is undervalued.
%20[19.57.16,%2019%20May,%202023]-638201066550167744.png)
Chainlink MVRV v. price
Typically, a negative MVRV score fuels a bearish thesis for the asset and is followed by a price decline in LINK, as seen in the chart above. Therefore, LINK price is likely to experience further pullback in the short-term.
LINK supply on exchanges climbs
Interestingly, the supply of Chainlink on cryptocurrency exchanges continued to climb over the past month. This has increased the selling pressure on the altcoin as LINK price is struggling to recover from its pullback.
LINK supply on exchanges climbed from 157.23 million in the beginning of April to 159.26 million as of May 19.
Large wallet addresses holding between 10,000 and 100,000 and 100,000 and 1,000,000 LINK tokens have added to their holdings, “buying the dip” while the asset is undervalued.
%20[20.02.03,%2019%20May,%202023]-638201066924813773.png)
Chainlink accumulation by whales
Where is LINK price headed next
Chainlink price is currently in a downward trend that started in April 2022. The Fibonacci levels derived from the altcoin’s decline from its April peak of $8.341 to June lows of $5.352 help identify key support and resistance levels for LINK.
LINK is currently trading below two key long-term Exponential Moving Averages, 50-day and 200-day at $6.970 and $7.271, respectively. Equal lows at $6.791 and the 23.6% Fibonacci level at $8.418 are other key resistance levels that LINK needs to tackle in its recovery.
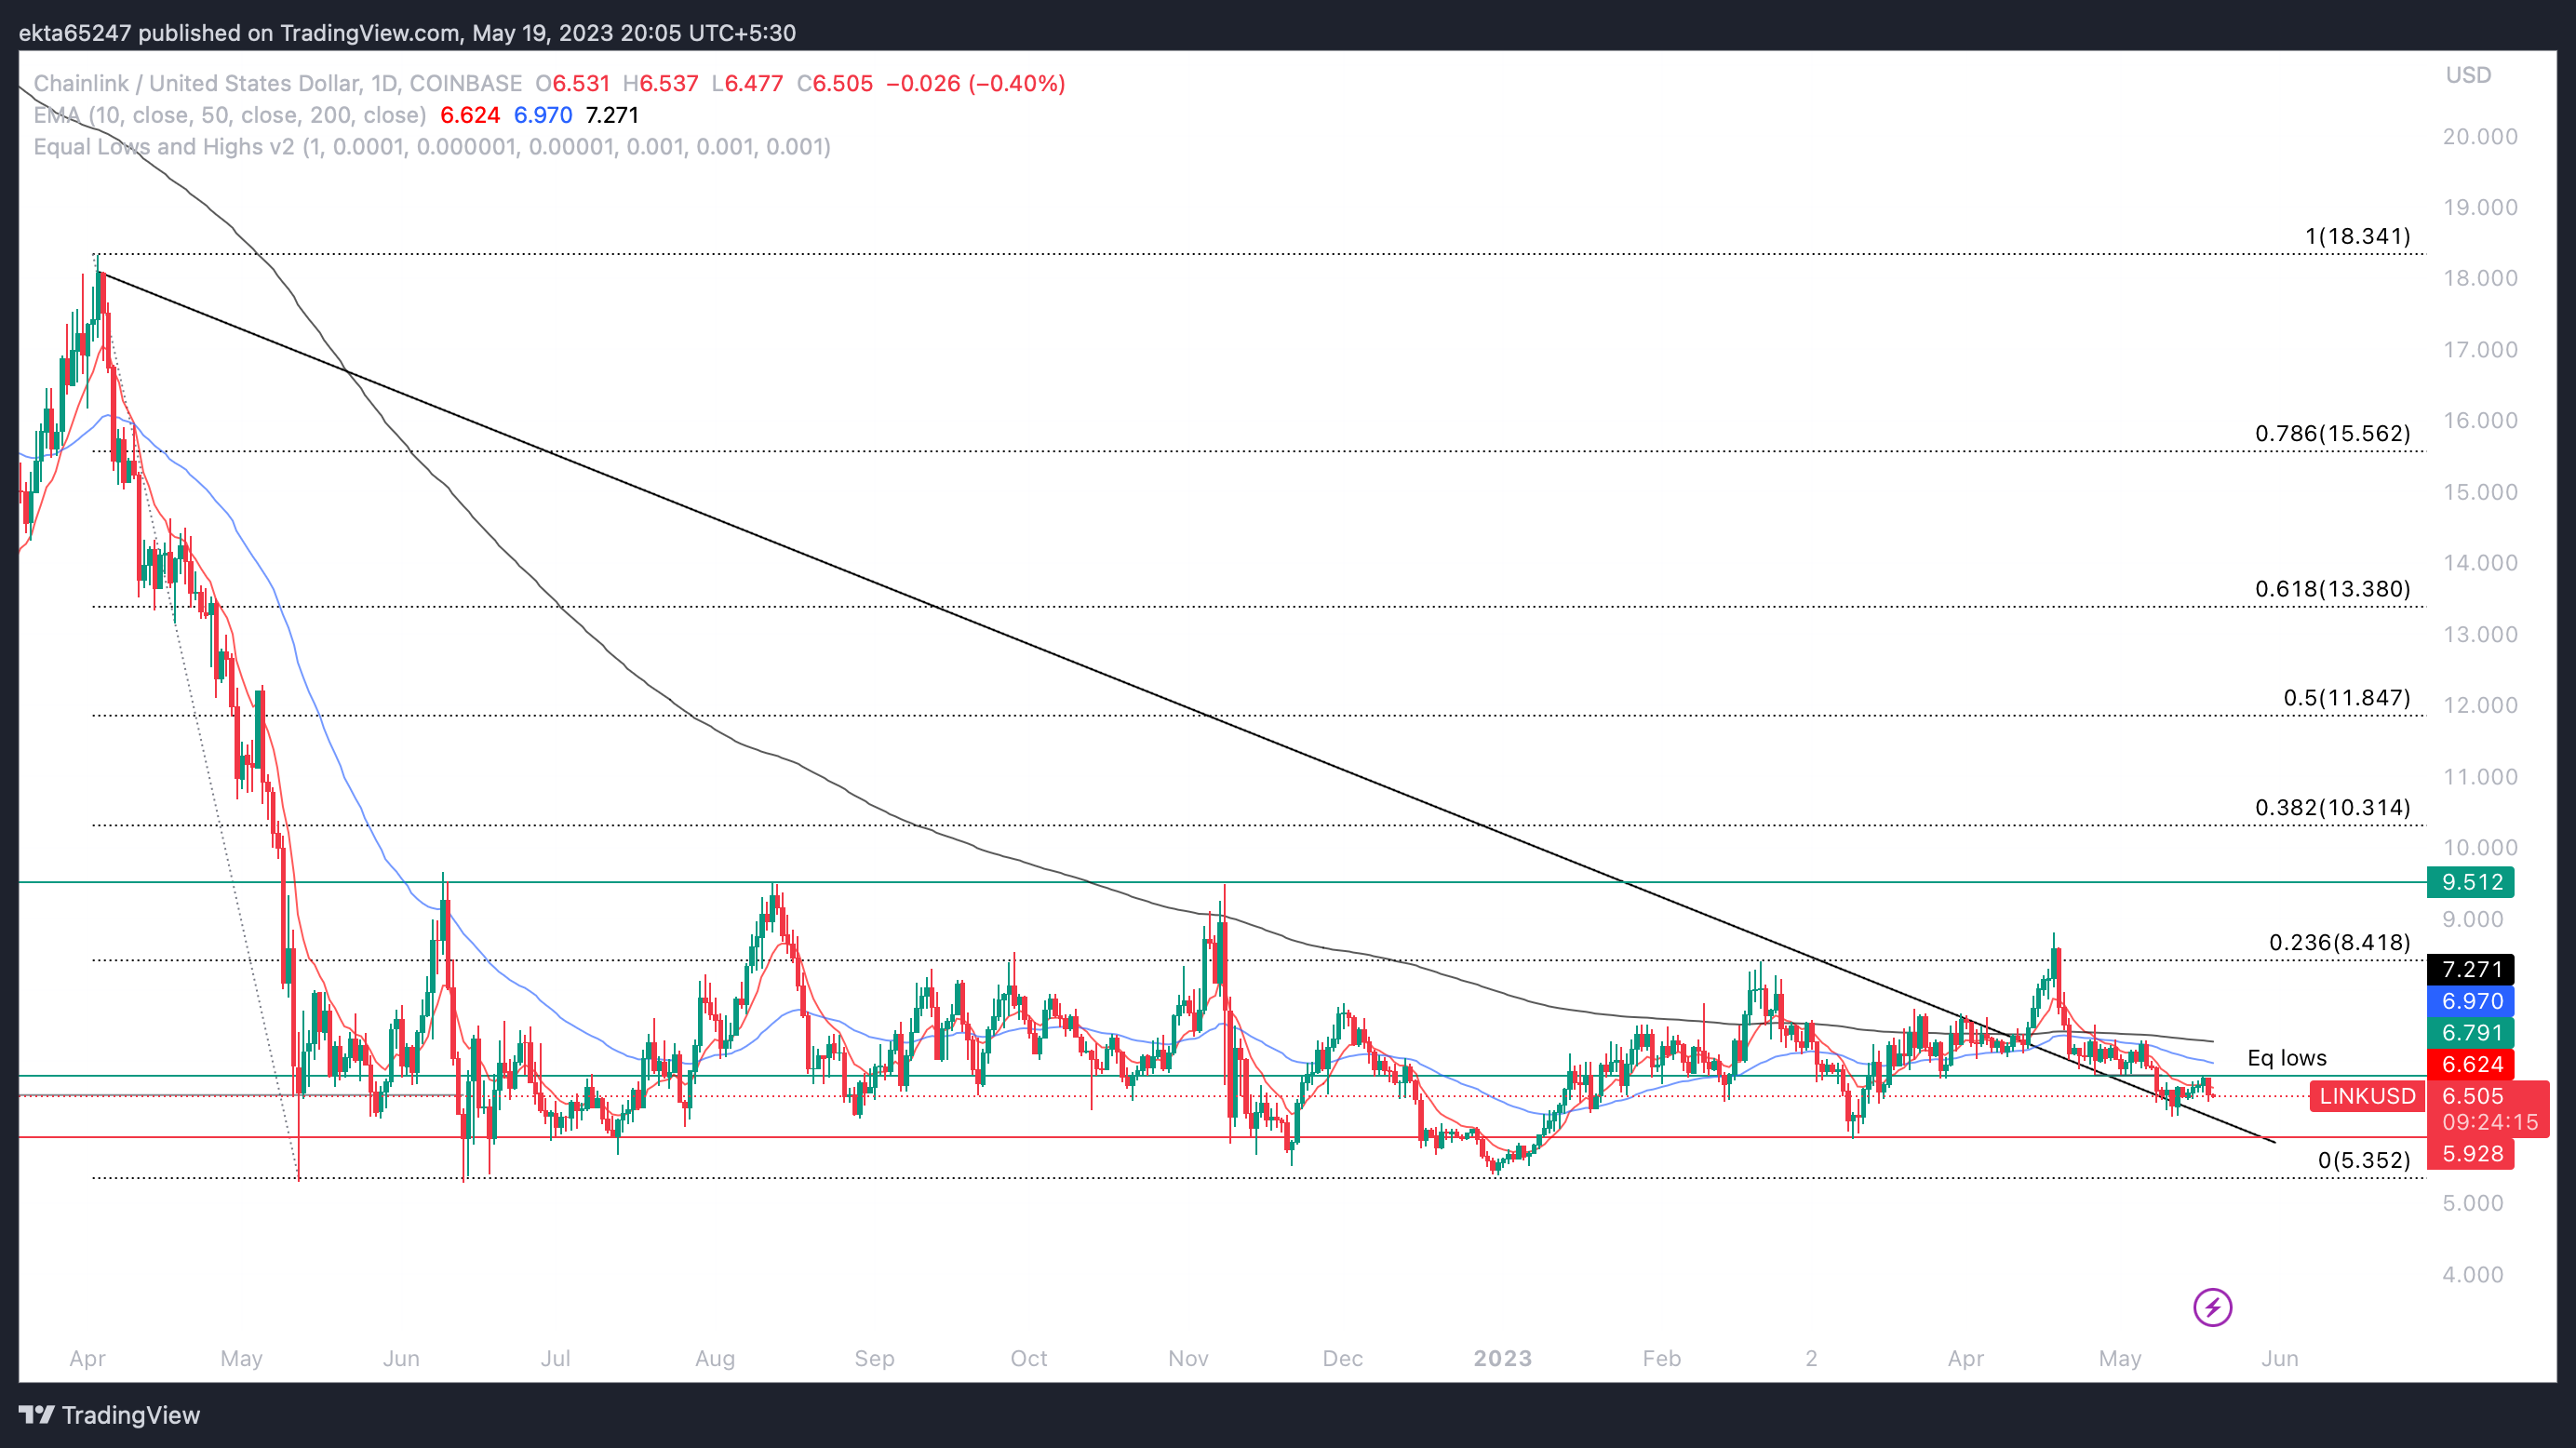
LINK/USD one-day price chart
If LINK price definitively closes below the trendline and nosedives from support at $5.928 the downside target is the June 2022 lows of $5.352.
Author

Ekta Mourya
FXStreet
Ekta Mourya has extensive experience in fundamental and on-chain analysis, particularly focused on impact of macroeconomics and central bank policies on cryptocurrencies.


