XRP price rally gains momentum with massive spike in XRP Ledger activity
- XRP Ledger noted a massive spike in daily active addresses and transactions.
- Alongside XRP Ledger’s activity growth, native token XRP witnessed a price rally.
- XRP price rally gains bullish momentum from the rising activity on XRP Ledger.

XRP Ledger, Ripple’s decentralized blockchain, noted an increase in activity over the past quarter. The quarter-on-quarter (QoQ) increase in daily active addresses and daily transactions is in the double digits, indicative of growth in adoption and utility.
The growth in XRPL’s utility has fueled a bullish thesis for native token XRP.
Also read: Bitcoin and Ethereum struggle with declining price volatility as options traders turn bearish
XRP Ledger notes spike in activity, bullish for XRP token
Based on data from crypto intelligence tracker Messari’s latest report on XRP Ledger’s QoQ growth, there is a notable increase in daily active addresses and transactions. While daily active addresses on the XRPL blockchain climbed 13.9%, there was a 10.7% QoQ increase in transactions on the ledger.
Interestingly, rising activity on the XRP Ledger acted as a bullish catalyst for native token XRP, driving the altcoin’s meteoric rise from $0.35 to $0.54. XRP’s growth outpaced competitors with large market capitalizations in Q1.
While the fate of XRP community holders hangs in the balance as they await the outcome of the US Securities & Exchange Commission’s (SEC) lawsuit against Ripple, the altcoin has yielded nearly a 10% gain over the past ten days.
XRP price analysis
XRP price is currently in an upward trend. The Fibonacci retracement of the XRP price decline from the March 2022 top of $0.91 to the June 2022 bottom of $0.28 marks the key resistance and support levels for XRP price.
In its climb toward the April 2023 peak of $0.58, XRP price faces immediate resistance at the 38.2% Fibonacci retracement at $0.52 and $0.53, a level that has acted as resistance for the past 12 months.
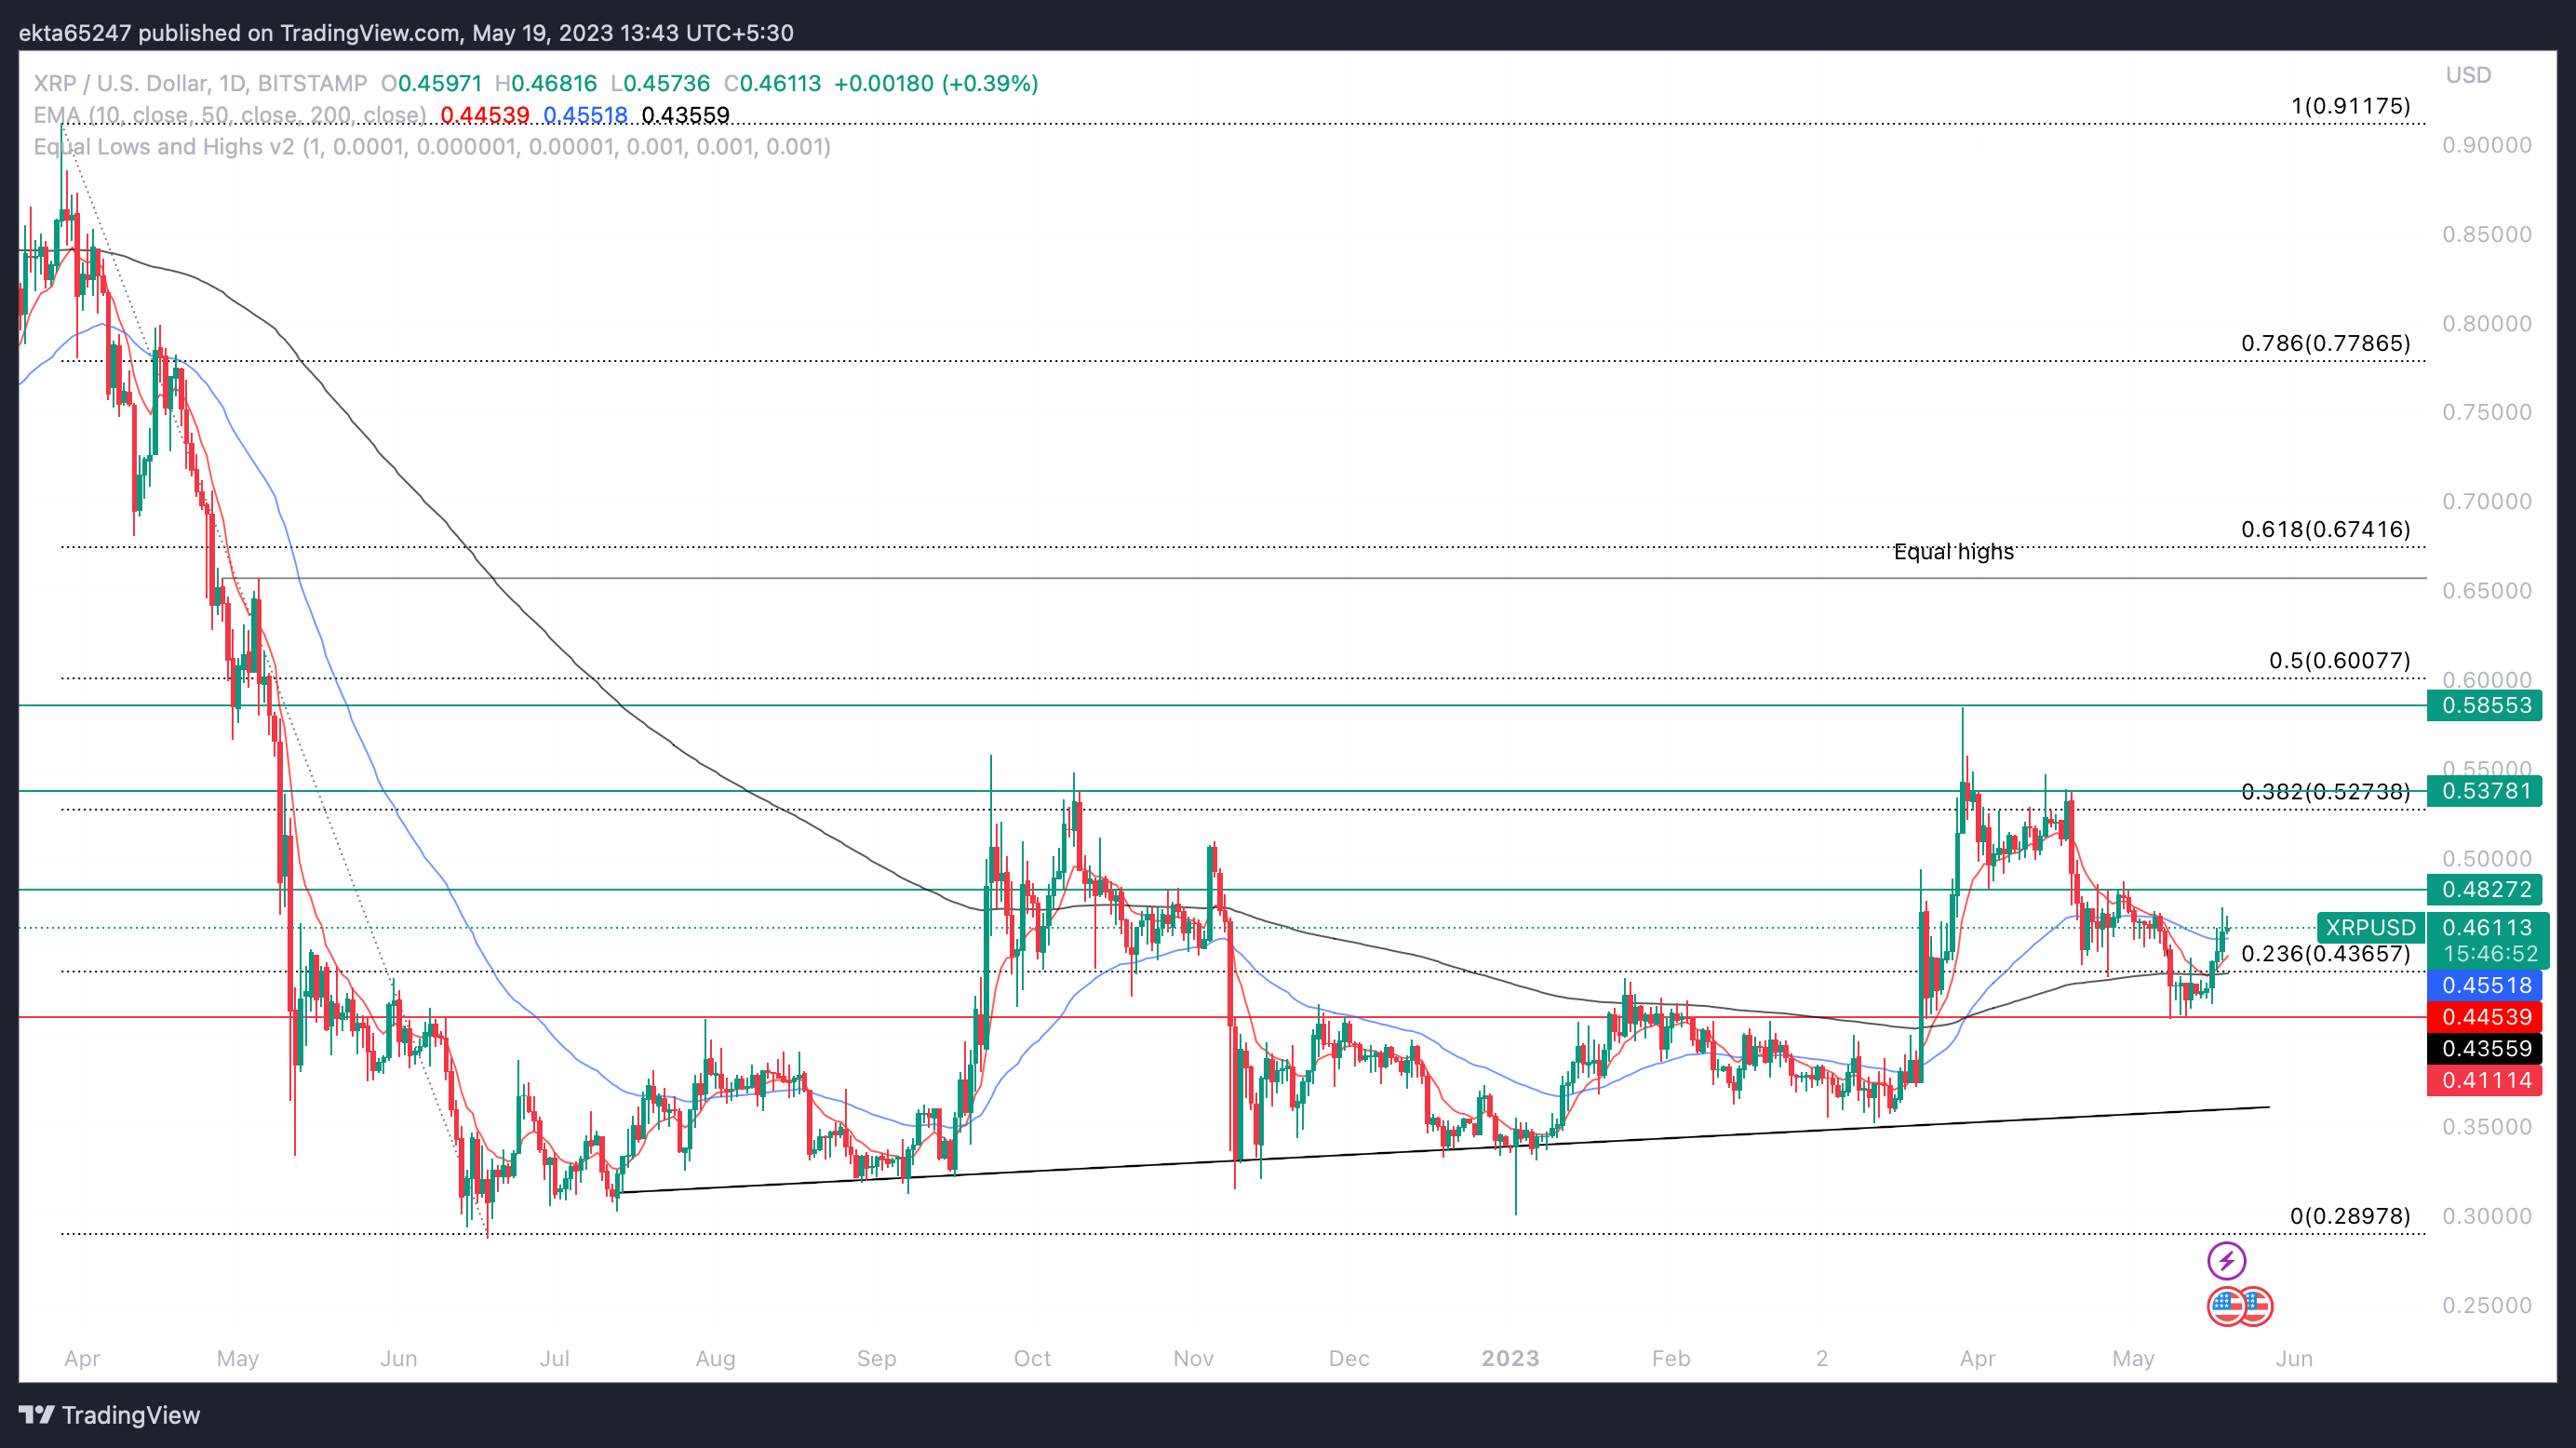
XRP/USD 1-day price chart
A decline below the three long-term Exponential Moving Averages – the 10-day at $0.44, 50-day at $0.45 and 200-day at $0.43 – could invalidate the bullish thesis for XRP. The downside target is the support at $0.44, a level that fortified XRP price action throughout April and May.
Author

Ekta Mourya
FXStreet
Ekta Mourya has extensive experience in fundamental and on-chain analysis, particularly focused on impact of macroeconomics and central bank policies on cryptocurrencies.


