Chainlink price rebound to consolidate, as LINK is locked in a corner
- Chainlink price strength puts bulls back on the bandwagon.
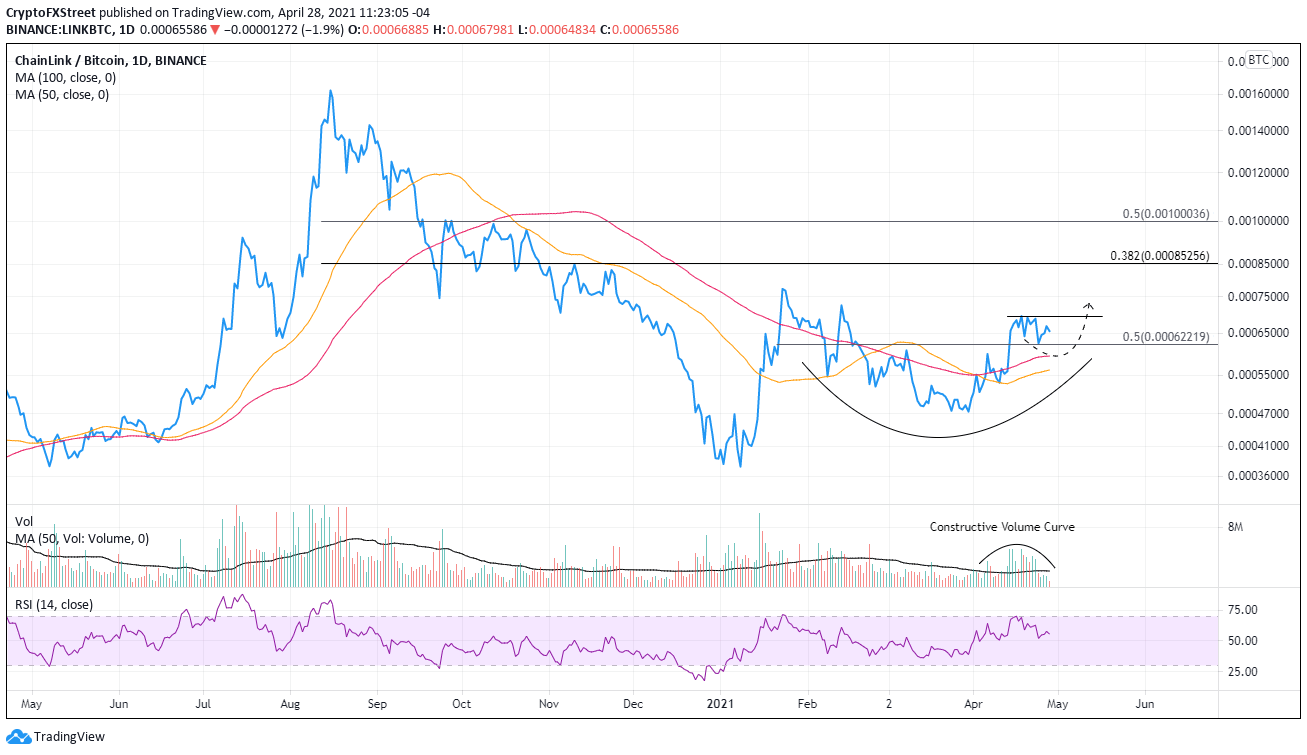
- LINK/BTC ratio shaping a bullish cup-with-handle pattern.
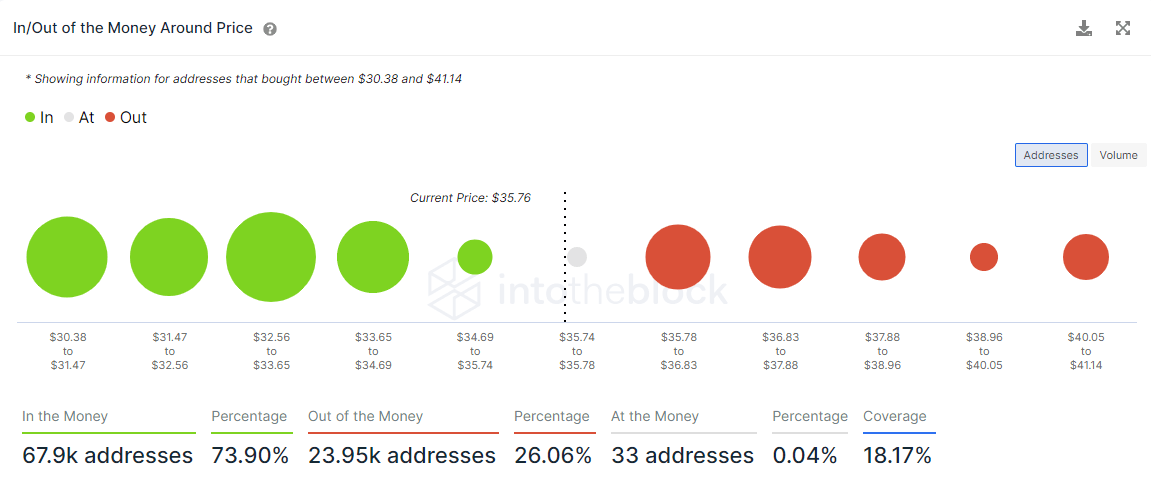
- IOMAP data reveals 74% of addresses are in the money, offering a firm source of support.
-637336005550289133.jpg)
Chainlink price has rebounded to the descending channel’s upper trend line, wedging LINK into a corner just above the top of a price congestion range that began in February. Upside may be limited in the short-term as the altcoin consolidates in a tight range, but there is a high probability that the current situation will resolve to the upside.
Chainlink price bolstered by on-chain metric
A close look at the Intotheblock In/Out of the Money Around Price (IOMAP) data exposes a large number of in-the-money addresses beginning at $34.69 and extending down to $30.38, positioning LINK to withstand any short term selling pressure comfortably.
The 66.92k addresses owning 65.24 million LINK stands in contrast to the marginal amount of out-of-the-money addresses, putting Chainlink price in an optimal position to absorb some selling before quickly breaking through the descending channel’s upper trend line.
LINK IOMAP data
LINK/BTC price pattern points to a window of opportunity for Chainlink speculators
Relative strength is fundamental to generating alpha, and how a cryptocurrency trades against BTC reveals when those windows of outperformance may emerge. Currently, LINK/BTC is shaping the handle of a bullish cup-with-handle pattern on the daily chart. If the pattern resolves to the upside and based on the measured move target, LINK will outperform BTC by almost 50% in the coming weeks or months.
It is not a far-fetched outlook for LINK/BTC considering the breakneck speed of projects adopting LINK’s decentralized oracle network to provide input on various external sources of data.
LINK/BTC daily chart
Chainlink price at a pivotal threshold in the road to overcoming topside trendline
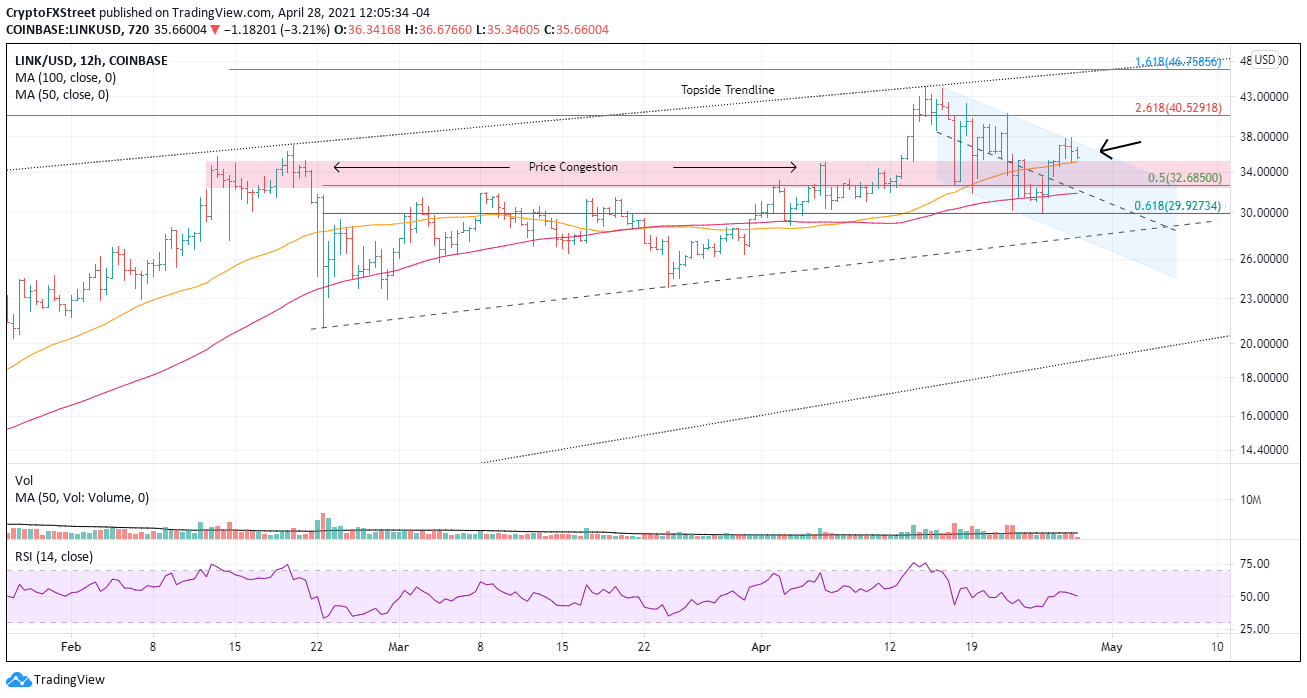
A quick review of the 12-hour chart below emphasizes the delicate position of LINK in the charts. The digital token has been forced into a corner by the upper range of price congestion and the channel’s upper trend line.
Using the on-chain metrics mentioned above combined with the chart’s technicals, it is possible to deliver a mildly bullish outlook for Chainlink price, but maybe after some consolidation.
Resistance begins at the channel’s upper trend line at $37.19, followed by the 261.8% Fibonacci extension of the August-September 2020 correction at $40.53. The significant resistance is at the topside trend line beginning in 2019 and running through 2020 high, and most recently, the February high. It currently sits at $46.30, just below the 161.8% extension of the February crash at $46.76.
LINK/USD 12-hour chart
With the IOMAP data showing broad support down to $30.38, LINK should not decline beyond the intersection of the 50% retracement of the February crash at $32.68, the channel’s midline at $32.06, and the 100 twelve-hour simple moving average (SMA) at $31.87.
Author

Sheldon McIntyre, CMT
Independent Analyst
Sheldon has 24 years of investment experience holding various positions in companies based in the United States and Chile. His core competencies include BRIC and G-10 equity markets, swing and position trading and technical analysis.


