Chainlink price bulls not active at current levels, leaving LINK vulnerable to a 25% decline
- Chainlink price forges descending channel with midline restraining rebounds.
- A series of 20% declines in April keeps speculators’ fingers off the buy button.
- iTrustCapital, the #1 Crypto IRA platform, announces that LINK is now available on their platform.
-637336005550289133.jpg)
Chainlink price is facing the test of overcoming the momentum of the descending channel and the price congestion between $32.70 and $35.75. A downside trajectory will continue to define the LINK charts in the short term.
Chainlink price looking down for shelter
LINK has been moving at breakneck speed in the cryptocurrency space as the number of projects adopting its oracle grows exponentially. However, the token price has been overwhelmed by the weakness in the broader market, keeping the strong bids on the sidelines.
Despite the selling, LINK does have an impressive range of support between $27.99 and $30.88, according to Intotheblock In/Out of the Money Around Price (IOMAP) data. A total of 46.24k addresses bought 66.48 million LINK. The range extends from just below the lower trend line of the channel to the 100 twelve-hour simple moving average (SMA), suggesting that a significant sell-off from current levels may not occur.
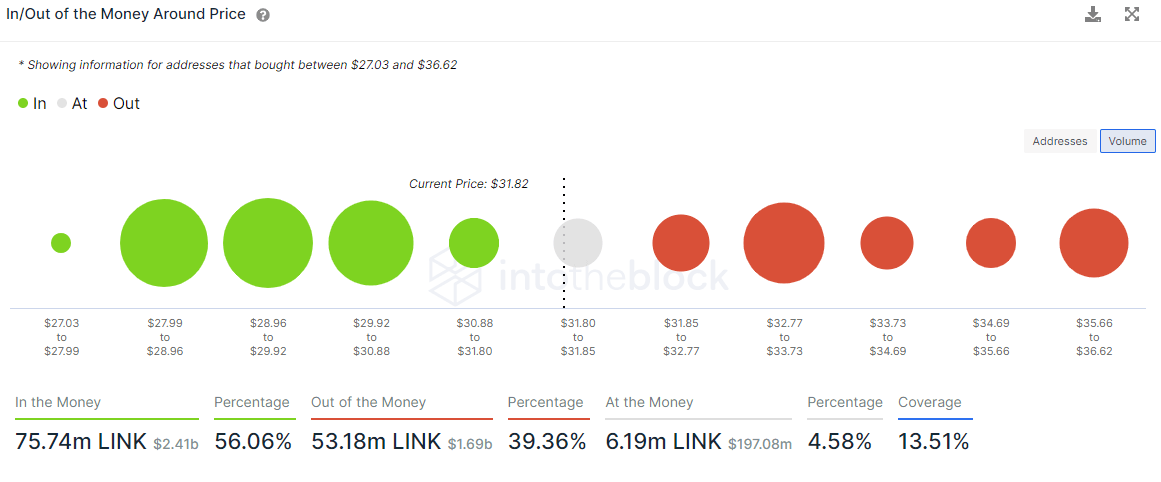
LINK IOMAP data
Contrary to the data point above, the charts illustrate a different picture for LINK. Before stalling at the topside trendline at $40.34 in mid-February, the digital token has swung according to the technicals, and that is not likely to change soon.
Note, LINK has crushed support at the 50% retracement of the February decline at $32.68, the 50-day SMA at $31.39, and got within a percent of the 61.8% Fibonacci retracement. The next critical support is the channel’s lower trend line at $28.90. A daily close below the trend line will usher in a test of the rising trend line from the February low at $27.10.
More significant losses could follow, including a test of the March 24 low at $23.75 and lastly, the channel’s measured move target at $21.68, representing a loss of 25% from the channel’s lower trend line.
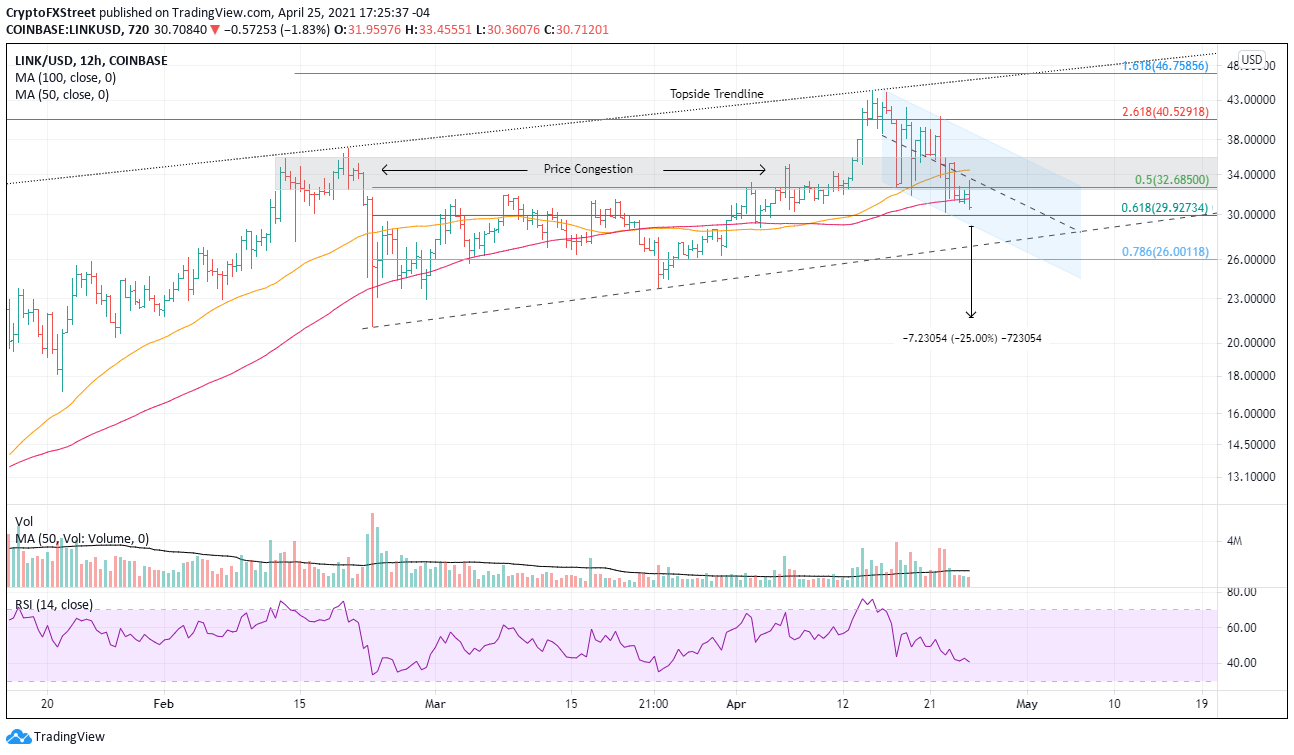
LINK/USD 12-hour chart
Before hysteria can return to LINK, the altcoin needs to close above the price congestion at $35.75 and the channel’s upper trend line currently at $39.10. For now, the best traders can hope for is trading the ranges.
Author

Sheldon McIntyre, CMT
Independent Analyst
Sheldon has 24 years of investment experience holding various positions in companies based in the United States and Chile. His core competencies include BRIC and G-10 equity markets, swing and position trading and technical analysis.


