|

Chainlink Price Prediction: LINK pushes for $40 as key indicator flashes buy signal

  • Chainlink price aims for a significant rebound as the TD Sequential indicator just presented a buy signal.
  • On-chain metrics indicate that there is not a lot of resistance on the way up. 
  • The number of large holders has decreased which could be a red flag.

Chainlink price has seen a massive rebound in the past 24 hours as the entire cryptocurrency market recovered significantly. The digital asset doesn’t face a lot of resistance ahead.

Chainlink price could explode to $40

On the daily chart, the TD Sequential indicator has presented a buy signal in the form of a red ‘9’ candlestick. LINK has already passed through the 50% Fibonacci retracement level at $34. 

link price

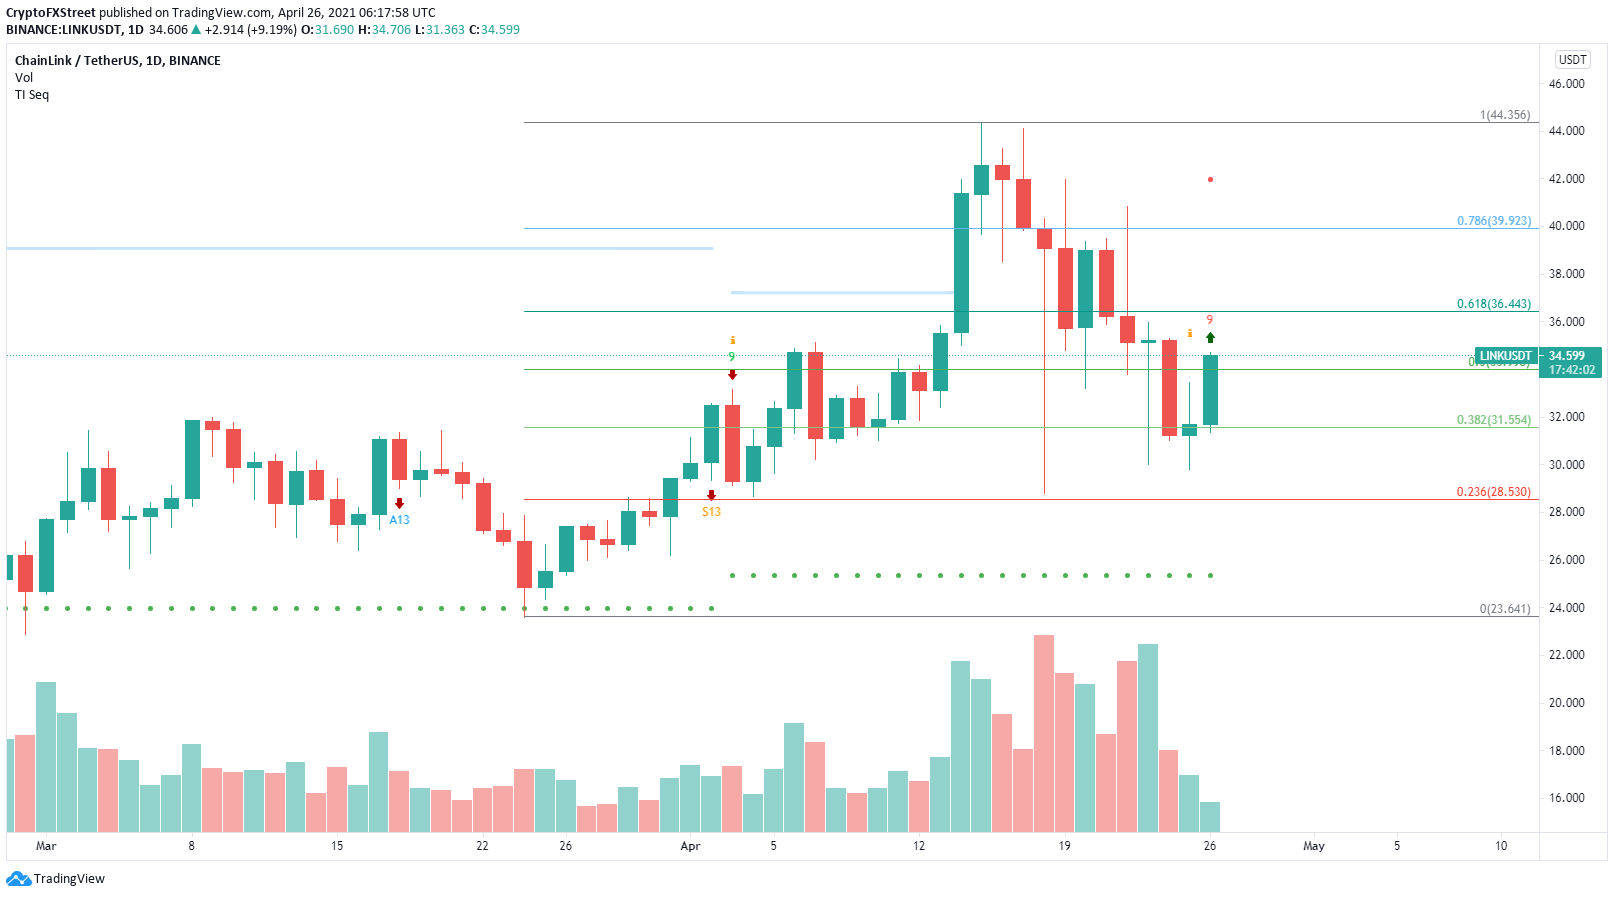
LINK/USD daily chart

The In/Out of the Money Around Price (IOMAP) chart only shows one significant resistance area between $35.4 and $36.45 where 6,120 addresses purchased 12.5 million LINK. A breakout above this point should quickly drive Chainlink toward the 61.8% Fibonacci retracement level at $36.4 and up to $40 at the 78.6% Fibonacci level.
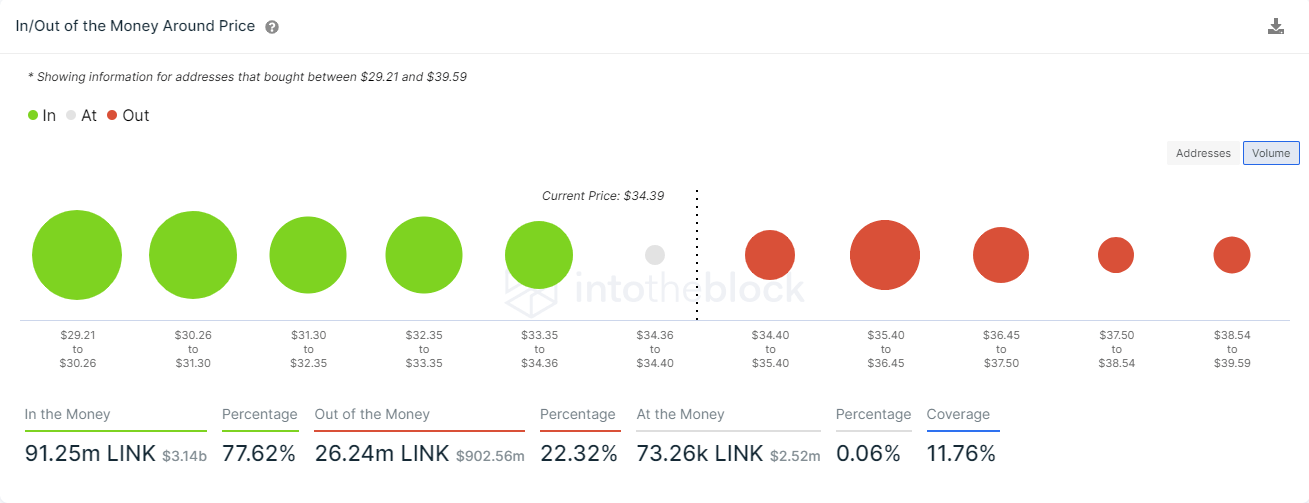
link price
 

LINK IOMAP chart

Additionally, the MVRV (30d) ratio which shows the average profit or loss of LINK tokens moved in the last 30 days, remains in the ‘buy zone’ which gives bulls a lot of room to work with before Chainlink could be at risk of a correction.

link price

LINK MVRV (30d) chart

Chainlink remains inside a descending parallel channel on the 4-hour chart. This pattern can be drawn by connecting the lower highs and lower lows with two parallel trend lines. 
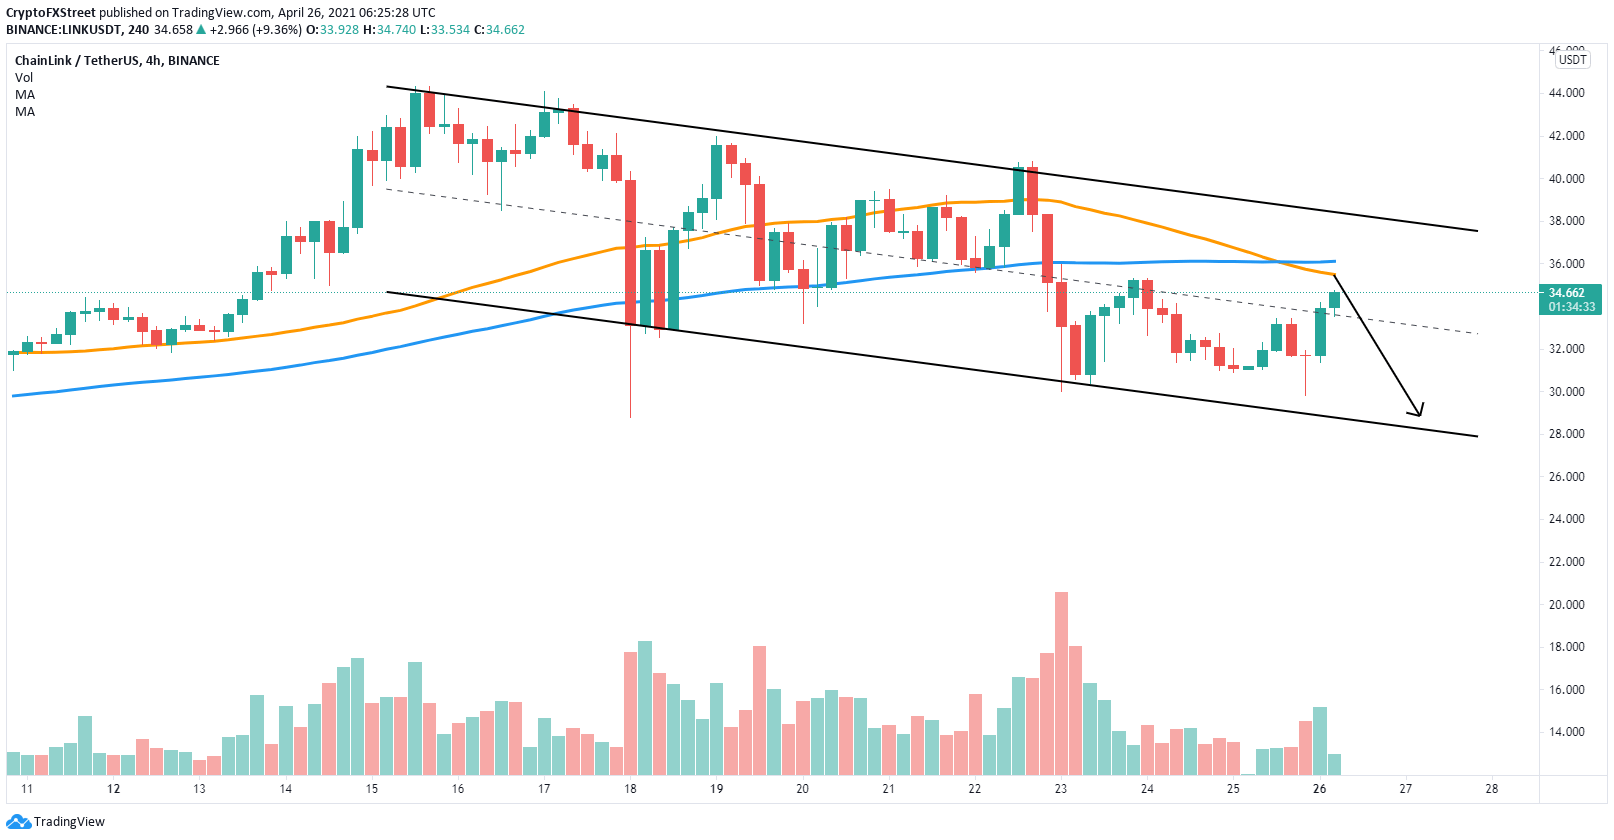
link price

LINK 4-hour chart

LINK faces a significant resistance level at $35.9 where the 50 and 100 SMA coincide. A rejection from this point will most likely drop toward $29.

Author

Lorenzo Stroe

Lorenzo Stroe

Independent Analyst

Lorenzo is an experienced Technical Analyst and Content Writer who has been working in the cryptocurrency industry since 2012. He also has a passion for trading.

More from Lorenzo Stroe
Share:

Editor's Picks

Bitcoin slips below $75,000 as selling pressure accelerates

Bitcoin (BTC) price falls below the $75,000 mark on Monday, having corrected nearly 11% in the previous week and reaching level not seen in nearly 10 months. Market momentum has clearly turned bearish, with technical indicators pointing to further downside toward the next key support at $70,000.

Top 3 Price Prediction: Bitcoin, Ethereum, and Ripple weakness persists after massive correction

Bitcoin, Ethereum and Ripple trade in red on Monday after dipping by over 11%, 19% and 13%, respectively, in the previous week. The top three cryptocurrencies have shed 10%, 17%, and 10.5% in the first month of 2026, highlighting persistent downside pressure.

Top Crypto Losers: Monero, Ethereum, and Kaspa face intense sell-off

Altcoins, including Monero, Ethereum, and Kaspa, are leading the broader cryptocurrency market decline with a steep correction on Sunday. Monero and Ethereum are close to critical support levels near $400 and $2,300, respectively.

Solana Price Forecast: SOL slips below $100, risks deeper correction

Solana (SOL) price extends its correction, trading below $100 on Monday after losing more than 15% in the previous week. The bearish price action is further backed by derivatives data, which shows rising short bets and negative funding rates.

Bitcoin Price Annual Forecast: BTC holds long-term bullish structure heading into 2026

Bitcoin (BTC) is wrapping up 2025 as one of its most eventful years, defined by unprecedented institutional participation, major regulatory developments, and extreme price volatility.

Bitcoin: BTC correction deepens as Fed stance, US-Iran risks, mining disruptions weigh

Bitcoin (BTC) price extends correction, trading below $82,000 after sliding more than 5% so far this week. The bearish price action in BTC was fueled by fading institutional demand, as evidenced by spot Exchange-Traded Funds (ETFs), which recorded $978 million in inflows through Thursday.