Chainlink Price Prediction: LINK about to jump above $15 as on-chain metrics show stable support
- Chainlink is vulnerable to price swings as the price is ready to break from a triangle pattern.
- LINK is poised for a 31% growth, provided that the price clears $15.
-637336005550289133.jpg)
Chainlink (LINK) is hovering at $14. The fifth-largest digital asset with a current market capitalization of $5.5 billion has gained 2.5% in the recent 24 hours and over 12% on a week-to-week basis.
LINK bottomed at $11.27 on November 26 and has been recovering steadily ever since. Moreover, both technical and on-chain metrics imply that the coin has potential to retest $15 amid growing bullish momentum.
LINK poised for a strong recovery
From the short-term point of view, LINK is moving inside a symmetrical triangle. This pattern is characterized by two trend lines connecting a series of beaks and bottoms. Usually, it indicates a state of uncertainty on the market and serves as a precursor for sharp price swings in the direction of the imminent breakout.
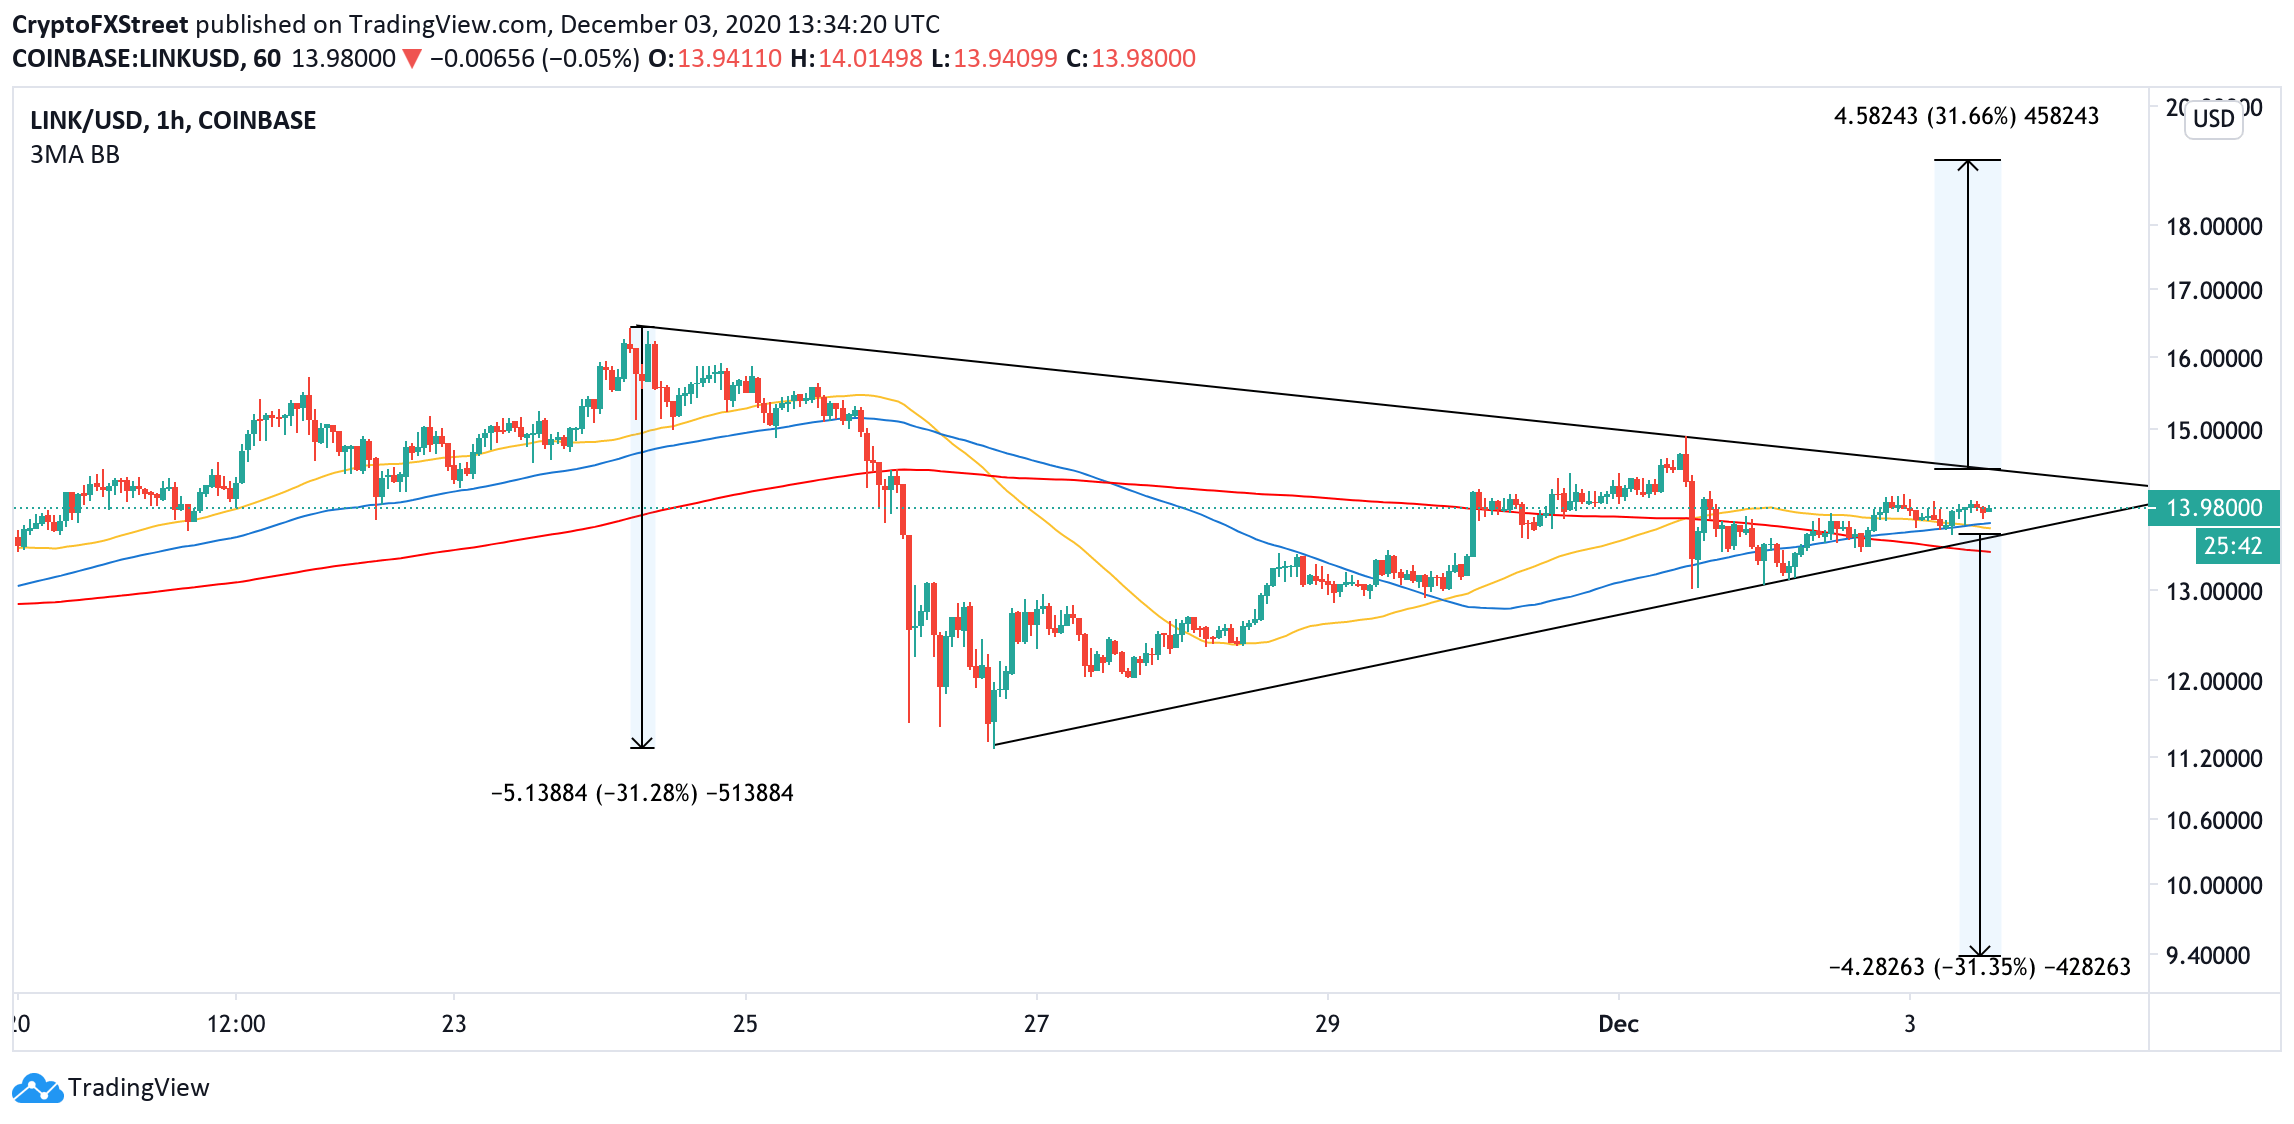
LINK 1-hour chart
If the downside trend line creating the upper boundary of the triangle gives way, LINK may extend the recovery towards $20. This target represents a 31% price increase, determined by measuring the distance between the widest point of the triangle and the potential breakout point.
However, based on IntoTheBlock's In/Out of the Money Around Price (IOMAP) model, over 14,000 addresses previously purchased over 3 million LINK tokens between $14.43 and $14.85, meaning that this barrier has the potential to slow down the upside momentum and push the price back inside the range.
%20Analytics%20and%20Charts-637426000506890856.png)
LINK In/Out of the Money Around Price
On the other hand, LINK sits on top of strong support below the current price. Over 9,500 addresses bought nearly 17 million LINK tokens on approach to $13.5. Even if the mentioned barrier is cleared, the bears will still have a hard time pushing the price through a thick layer of buy orders that go all the way down to $11.28, the recent bottom. If this area is broken, the sell-off may continue towards $9.4, which is a measure downside target of the symmetrical triangle.
Author

Tanya Abrosimova
Independent Analyst


