Chainlink could provide buying opportunity before 50% rally
- Chainlink price likely to rally to local top at $20 after retesting previous support level.
- High network growth and whales buying the dips suggest LINK is poised for a significant upswing.
- A weekly candlestick close below $13.59 would invalidate this bullish thesis.

Chainlink (LINK) price has broken out of the downtrend from the ongoing consolidation and rallied 19%, where it is facing some resistance. A possible price correction to the major support area could be a buying opportunity for the investors before the second bullish leg.
Chainlink price looks encouraging
Chainlink price crashed 49% from its local top formed on March 11 and stabilized between the $12.35 and $16.04 range. In line with general market conditions, LINK triggered a 19% rally, which ended the consolidation. During this ascent, the Oracle token decisively breached the 200-day exponential moving average (EMA), signaling a major shift in the momentum favoring bulls.
While this move was bullish, Chainlink price is currently facing resistance due to a daily bearish order block where large market participants have previously placed sell orders at $17.58, which confluences with the weekly resistance level at $16.48. If the buyers fail to push LINK higher, a retracement is likely. In such a case, the volume profile indicator shows that the major chunk of the volume was traded at around $14.62 and could support the potential correction outlined above. The $14.62 level also coincides closely with the 61.8% Fibonacci retracement level, making it a good place to accumulate for the second bullish leg.
With the recent uptick in bullish sentiment due to Ethereum spot ETF approval, if Chainlink price can find support around $14.62, resulting in an 18% rally to $17.58, the previously mentioned daily order block. A flip of this level, in a highly bullish case, could send Chainlink price to $22, bringing the total gain to 50%.
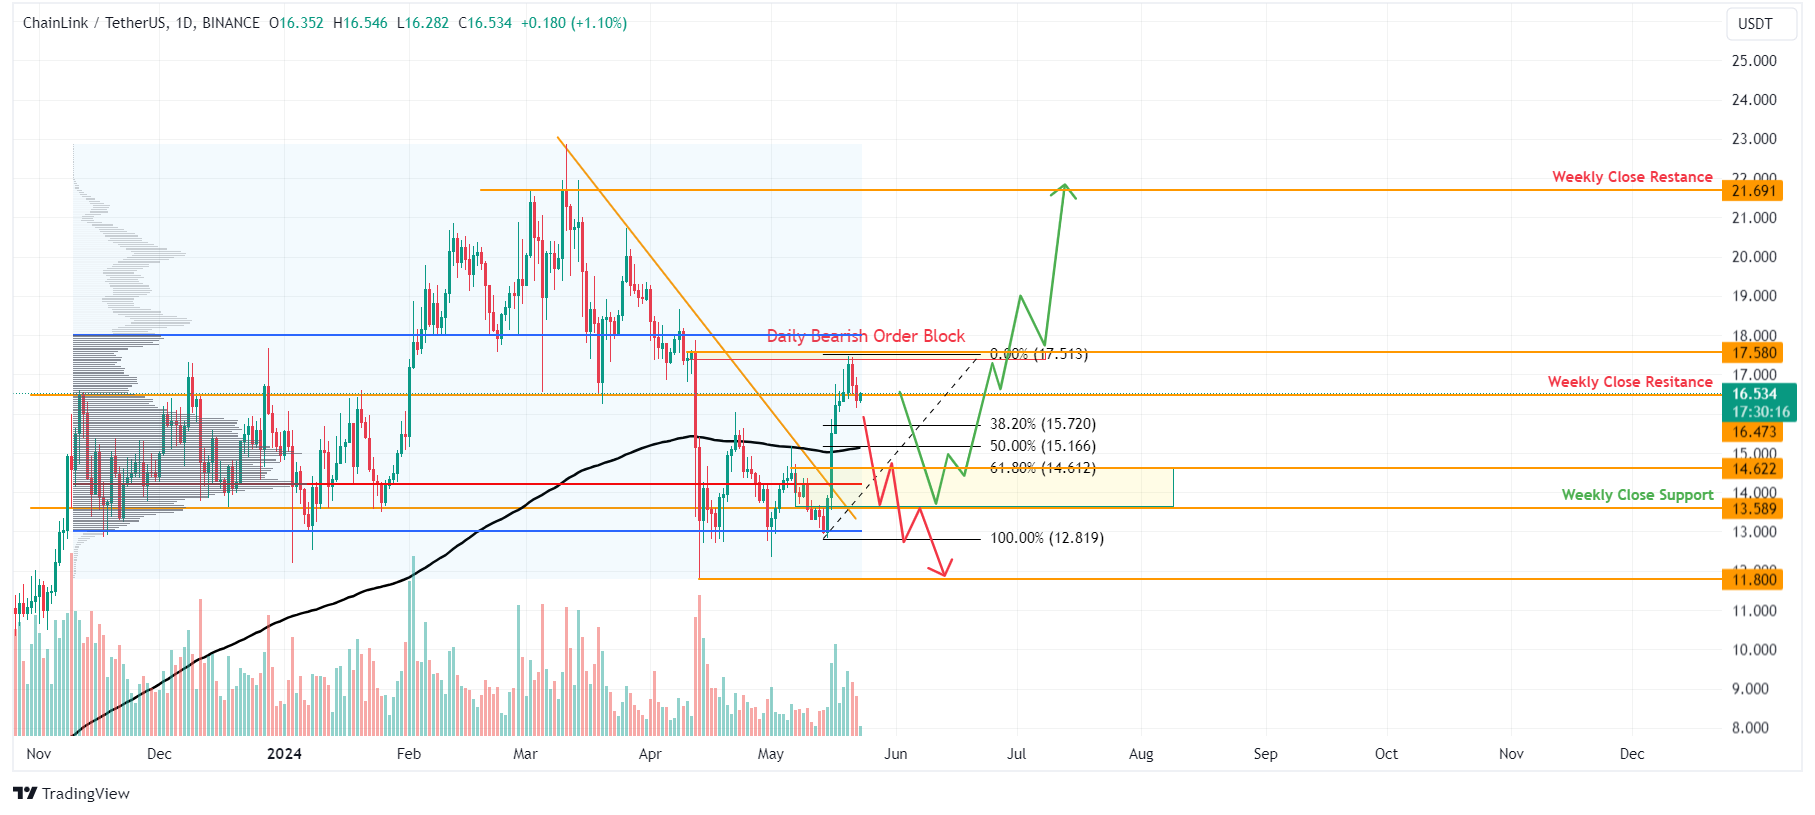
LINK/USDT 1-day chart
On-chain data from IntoTheBlock adds a bullish view for Chainlink. The number of active addresses increased dramatically from 2,900 on May 18 to 11,300 on May 21, implying a growing demand for the Chainlink network.
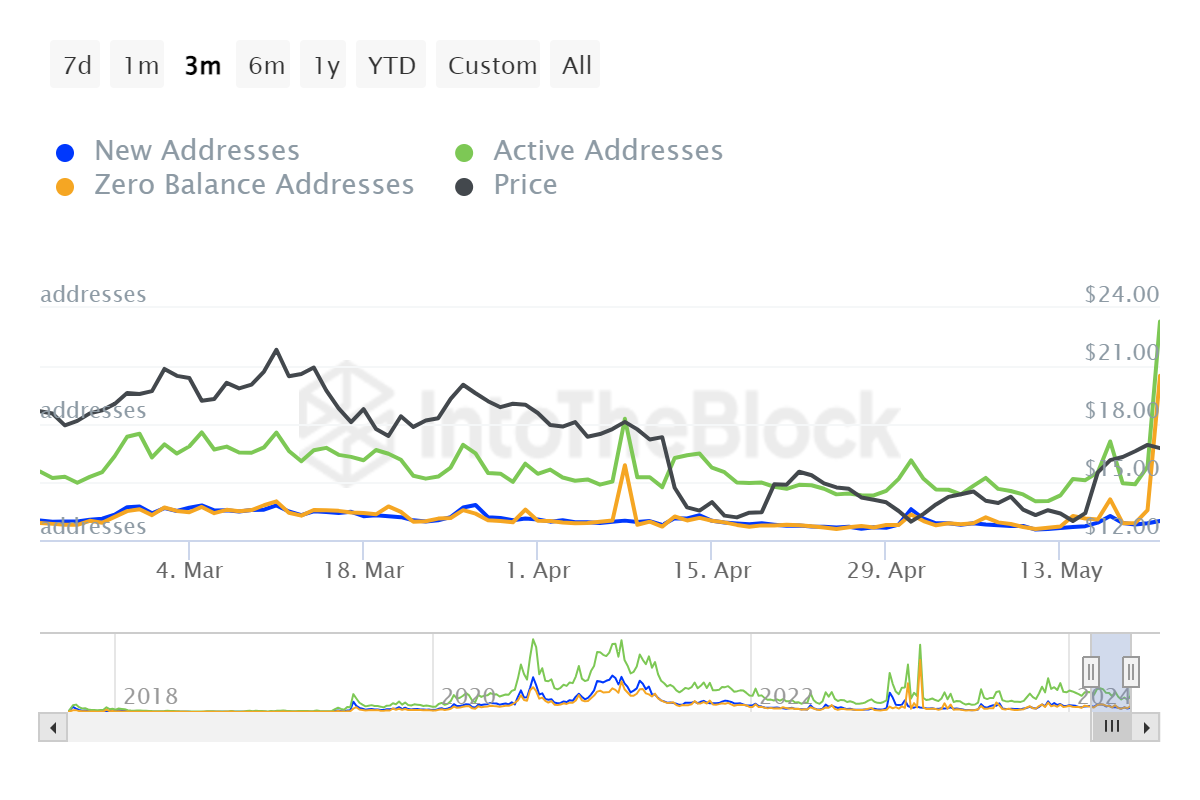
LINK Daily Active Addresses
Data from IntoTheBlock show that the large transactions volume indicator, which measures the daily average volume of transactions worth $100,000 or more, saw an unusual spike on April 13. This index is used as a proxy of whales’ investment. Typically, if this metric spikes after a rally, it can be assumed that institutional investors are looking to sell. On the contrary, if this index shows an uptick after a drop, it could mean that these whales are buying the dip.
In Chainlink’s case, the spike on April 13 corresponds to a potential buy-the-dip activity and can be viewed as a bullish signal.
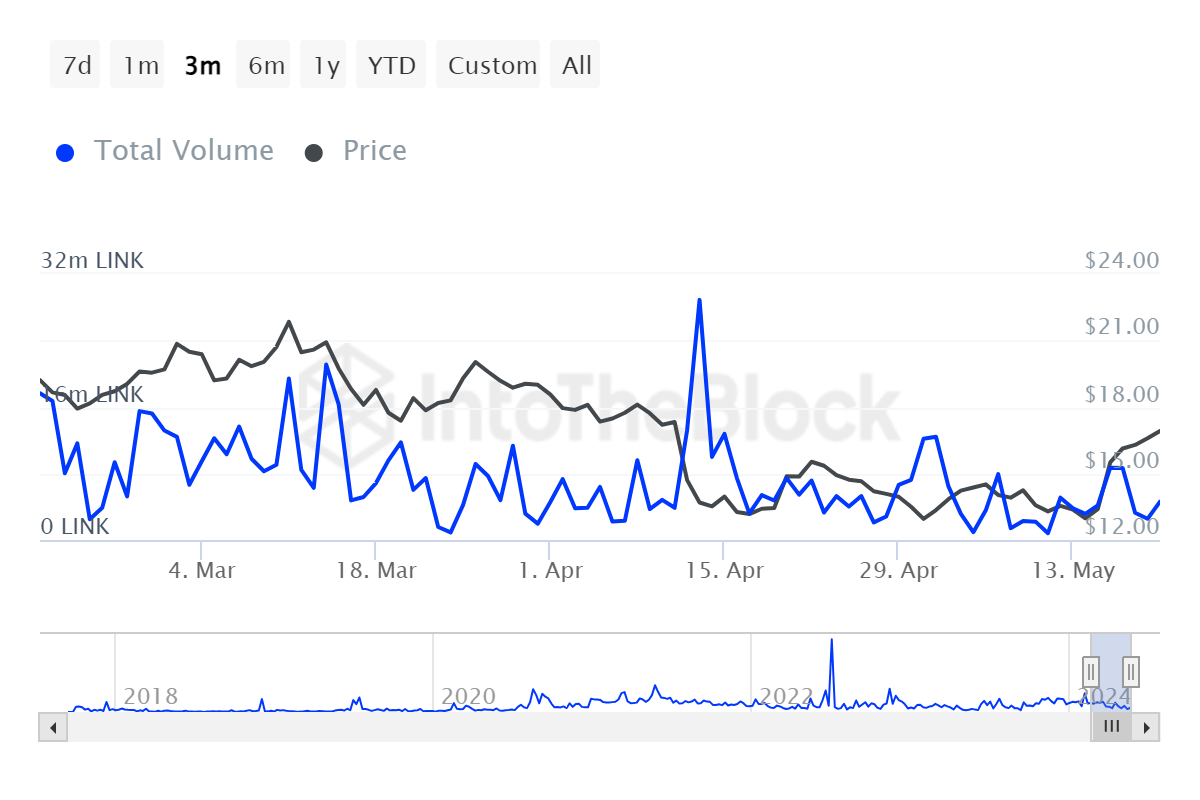
LINK Large Transactions Volume
Despite strong technical analysis and on-chain data, if the Chainlink price produces a weekly candlestick close below $13.59, it would invalidate the bullish thesis by producing a lower low on a higher timeframe. This development could see LINK price fall 13% to a key support level of $11.80.
Author

Manish Chhetri
FXStreet
Manish Chhetri is a crypto specialist with over four years of experience in the cryptocurrency industry.


