- Cardano price shows a pullback toward the lower trend line of an ascending triangle setup.
- The MRI’s State Trend Resistance at $1.35 is likely to be tested on its way down.
- A bounce from $1.35 or the upper boundary of the demand zone at $1.26 seems plausible.
Cardano price is headed south to produce another higher low before breaking out of a bullish pattern.
Cardano price takes another jab
Cardano price set up its all-time high at $1.48 on February 27 and has formed multiple higher lows and a series of highs since then. An ascending triangle is created when these swing points are connected using trend lines.
This setup forecasts a 45% upswing, determined by adding the distance between the pivot high and low to the breakout point at $1.48.
This move places ADA at $2.16.
The recent attempt by Cardano bulls to breach this trend line was not successful as short-term sellers overwhelmed the buyers leading to a close below the crucial resistance at $1.48. This rejection caused ADA to kickstart a retracement that could bounce from the MRI’s State Trend Resistance at $1.35 or the triangle’s hypotenuse at $1.26. Interestingly, this level coincides with the demand zone that ranges from $1.17 to $1.26.
Cardano price latest breakout attempt has set up a supply zone around the triangle’s baseline that extends from $1.45 to $1.52. Hence, clearing this area will show bulls’ conviction to surge to new highs.
In case of a successful swing high above $1.52, investors can expect ADA to rally toward a new all-time high at $2.16 with a pitstop at $1.81.
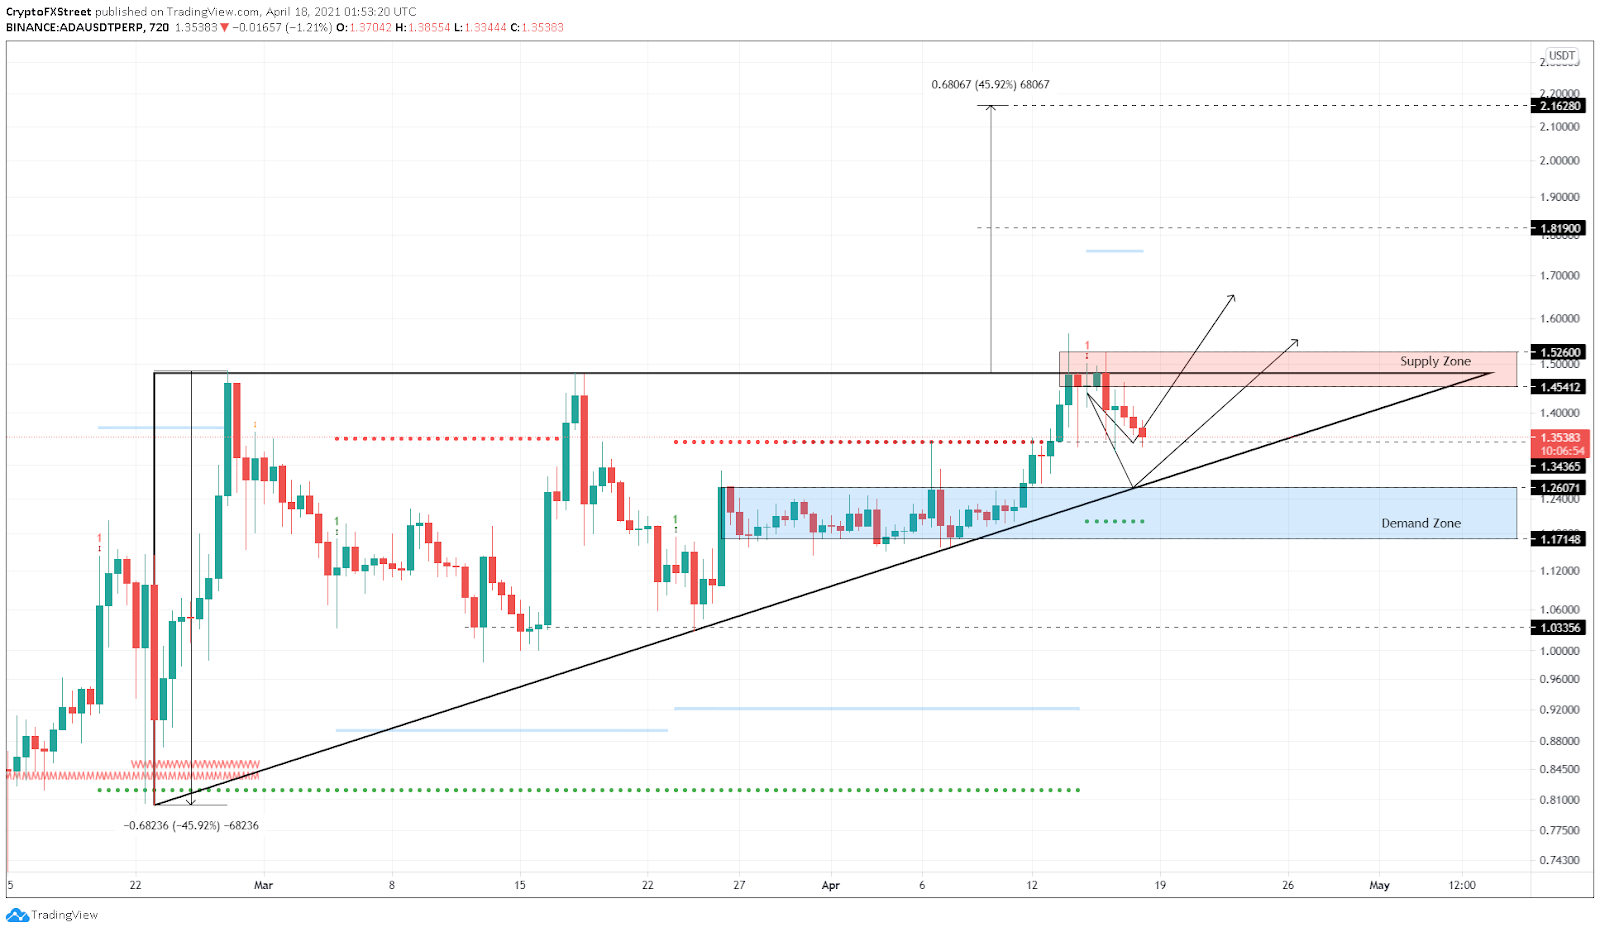
ADA/USDT 12-hour chart
This bullish outlook will flip upside down if the buyers fail to dampen or overwhelm the selling pressure. Therefore, a breakdown of the triangle’s hypotenuse that results in a decisive close below $1.17 will create a lower low, signaling the start of a new downward trend.
In such a case, 11% pullback to $1.03 seems logical.
Information on these pages contains forward-looking statements that involve risks and uncertainties. Markets and instruments profiled on this page are for informational purposes only and should not in any way come across as a recommendation to buy or sell in these assets. You should do your own thorough research before making any investment decisions. FXStreet does not in any way guarantee that this information is free from mistakes, errors, or material misstatements. It also does not guarantee that this information is of a timely nature. Investing in Open Markets involves a great deal of risk, including the loss of all or a portion of your investment, as well as emotional distress. All risks, losses and costs associated with investing, including total loss of principal, are your responsibility. The views and opinions expressed in this article are those of the authors and do not necessarily reflect the official policy or position of FXStreet nor its advertisers. The author will not be held responsible for information that is found at the end of links posted on this page.
If not otherwise explicitly mentioned in the body of the article, at the time of writing, the author has no position in any stock mentioned in this article and no business relationship with any company mentioned. The author has not received compensation for writing this article, other than from FXStreet.
FXStreet and the author do not provide personalized recommendations. The author makes no representations as to the accuracy, completeness, or suitability of this information. FXStreet and the author will not be liable for any errors, omissions or any losses, injuries or damages arising from this information and its display or use. Errors and omissions excepted.
The author and FXStreet are not registered investment advisors and nothing in this article is intended to be investment advice.
Recommended Content
Editors’ Picks
Ripple's move above this key level could trigger nearly 50% rally for XRP
Ripple has overcome a critical resistance level and flipped into a support floor on the weekly time frame. This development happened while XRP tightly consolidated for roughly 250 days. Investors can expect XRP to kickstart a massive rally.
Optimism price outlook with nearly $90 million worth of OP tokens flooding markets on Friday
Optimism volatility has shrunk in the ours leading to the network’s cliff unlock. It joins the likes of dYdX and Sui, which have similar events on their calendars. As token unlocks are often considered bearish catalysts, investors should brace for a reaction after the event.
Top 3 Price Prediction Bitcoin, Ethereum, Ripple: Retail watches from the sidelines with a bias for shorts
Bitcoin could clear $73,777 peak as BTC bulls resurface. Ethereum might fall 10% before next leg up as ETH RSI teases with sell signal. XRP could lose $0.6000 threshold as Ripple bulls fail to show up.
Jito price could hit $6 as JTO coils up inside this bullish pattern
Jito price action shows a potential cup and handle formation. Based on theoretical measurement rules, a successful breakout could yield a 56% rally to $6.0. A breakdown of the $3.86 support level would create a lower low for JTO and invalidate the bullish thesis.
Bitcoin: BTC may have recovered, but is it out of the woods?
Bitcoin’s (BTC) upward momentum has shown a significant decline for the past two weeks or so. This development led to a bearish signal on the weekly and an uncertain outlook on the monthly.