Cardano Price Forecast: ADA defines rare pattern, projects a 65% move
- Cardano price forming complex price pattern, despite recovering the strategically important 200-day simple moving average (SMA), now at $1.16.
- The range of $0.90-$1.00 has been superior support for the last five months, preventing a monthly close below the psychologically important $1.00.
- ADA has registered the best 4-day gain since June but still lags earlier moves in the year.

Cardano price discovered support at the lower trend line of a symmetrical triangle on July 21, resulting in a solid 4-day gain of 15.29%. Still, ADA has failed to extend the rally beyond the initial spike on July 21. The lack of traction does raise a red flag for the rebound and the potential for the cryptocurrency to crack the intimidating resistance between $1.30 and $1.40. Nevertheless, it is the last stage of a complex price pattern.
Cardano price raises the stakes, puts investors on alert
Over the last six days, ADA has overcome the support projected at the 200-day SMA at $1.14 and the triangle’s lower trend line, then at $1.05, before striking the critical $1.00 and registering an oversold condition on the daily Relative Strength Index (RSI).
The following four days have generated a 15.29% gain at writing, lifting Cardano price above the 200-day SMA. Still, momentum has quickly waned, putting bullish ADA projections of a breakout to the upside from the symmetrical triangle in doubt.
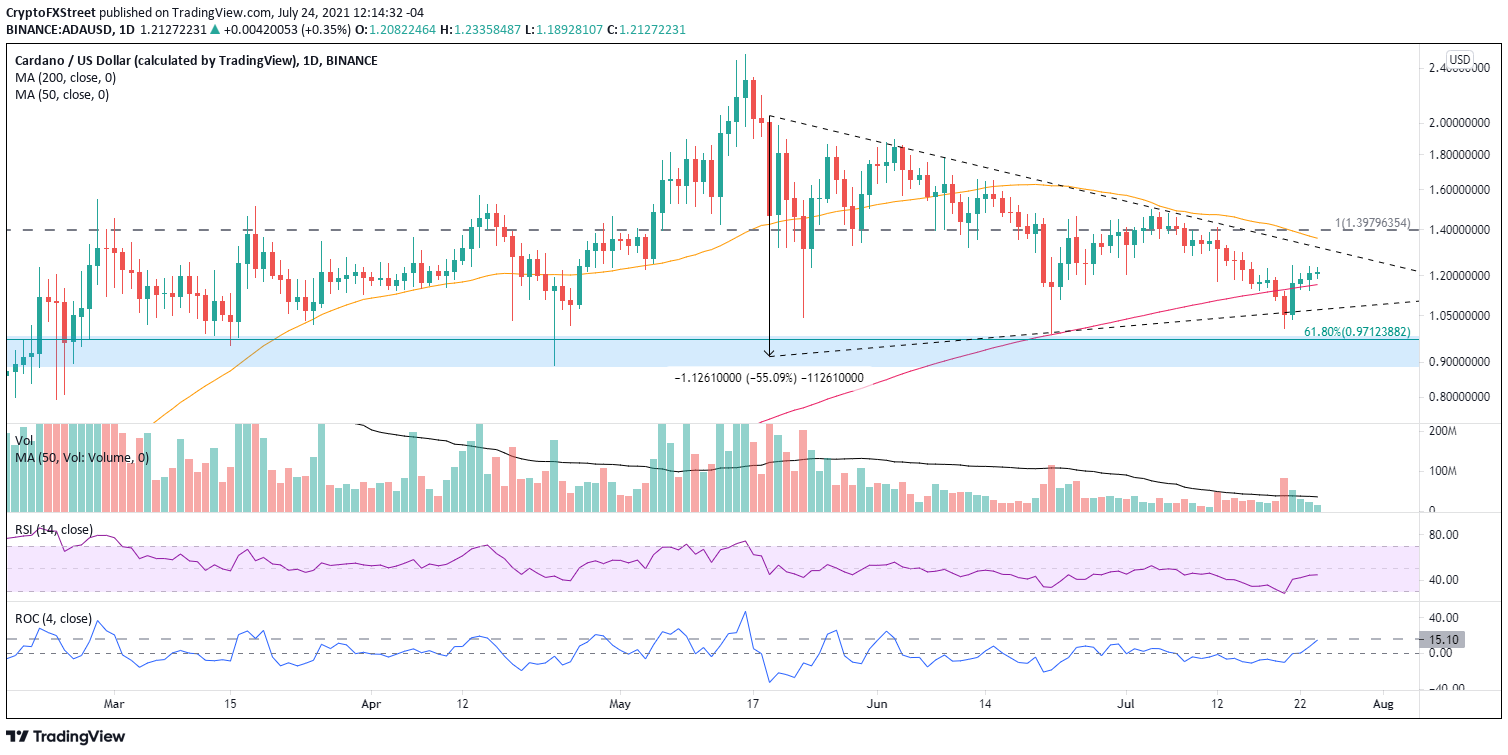
ADA/USD daily chart
However, the symmetrical triangle is the conclusion of a complex price pattern, taking the formation of a diamond that began in February. A diamond pattern is rare, but it can be powerful. The measured move of the ADA diamond pattern is 65%, projecting a downside price target of $0.36, while the upside target is $2.11 from the breakout above the triangle’s upper trend line.
Statistically, the percentage of the downside breakouts reaching the price target is 63%, and it is 65% on the upside. The percent that breaks to the downside is 54%. The pattern is not activated until there is a good daily close below or above one of the ADA trend lines.
Looking at the support and resistance levels of the Cardano chart structure, it is clear that the fulfillment of the measured move targets will face tremendous resistance. On the downside, there is the reinforced $0.90-$1.00 range, a level that ADA has not closed below on a weekly basis since early February, despite several tests.
On the upside, Cardano price is confronted by the union of the 2018 high at $1.40 and the 10-week SMA at $1.41.
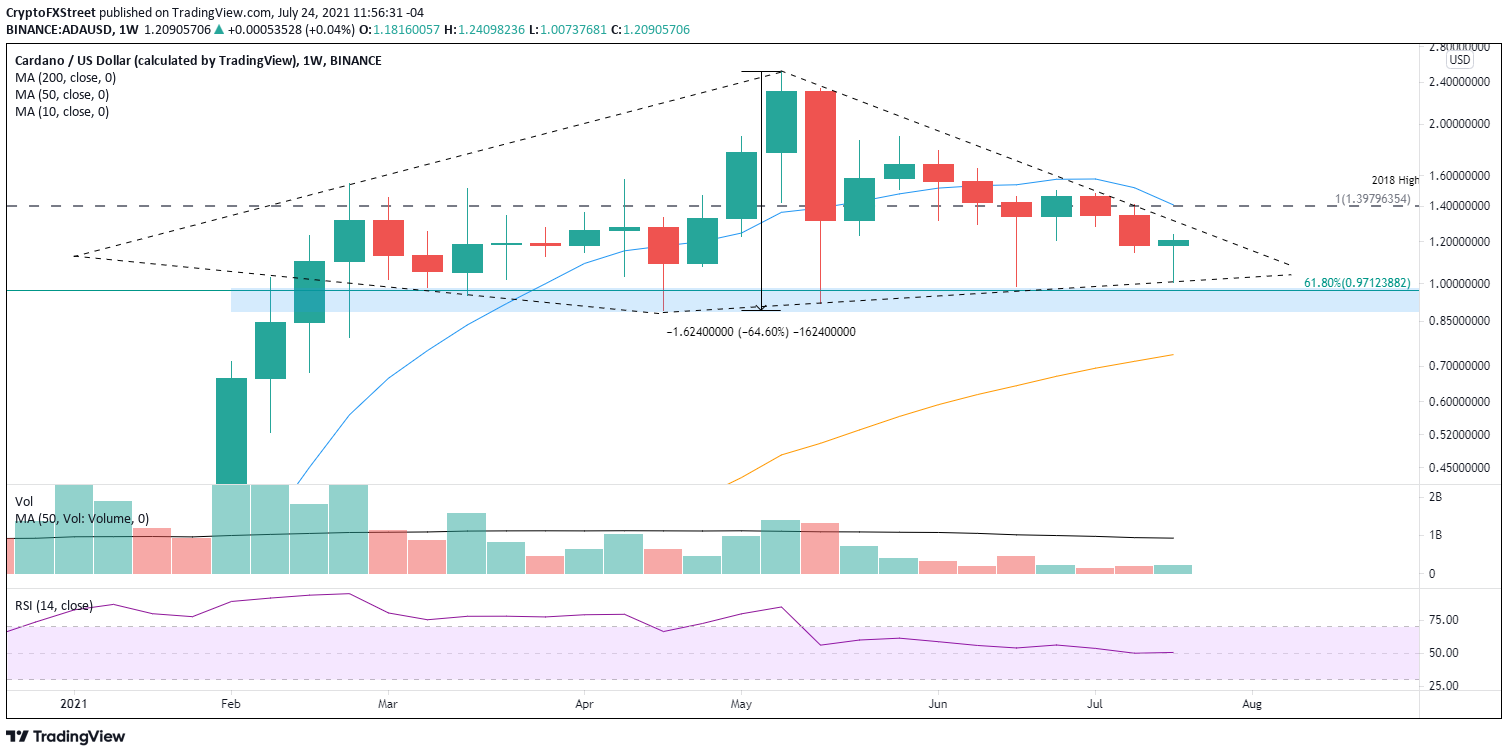
ADA/USD weekly chart
At this point, it is critical to let the ADA diamond pattern trigger and not get caught in the fluctuations of the concluding symmetrical triangle. Either way, Cardano price has the potential to deliver a 65% return.
Conclusively, Cardano price has raised the stakes with the diamond pattern, but until it activates on a daily closing basis, ADA remains a diamond in the rough.
Here, FXStreet's analysts evaluate where ADA could be heading next as it seems bound for higher highs.
Author

Sheldon McIntyre, CMT
Independent Analyst
Sheldon has 24 years of investment experience holding various positions in companies based in the United States and Chile. His core competencies include BRIC and G-10 equity markets, swing and position trading and technical analysis.


