|

Can this support level protect Solana price from a 30% crash

  • Solana price is close to touching the range low at $80, a breakdown of which could lead to a steep correction.
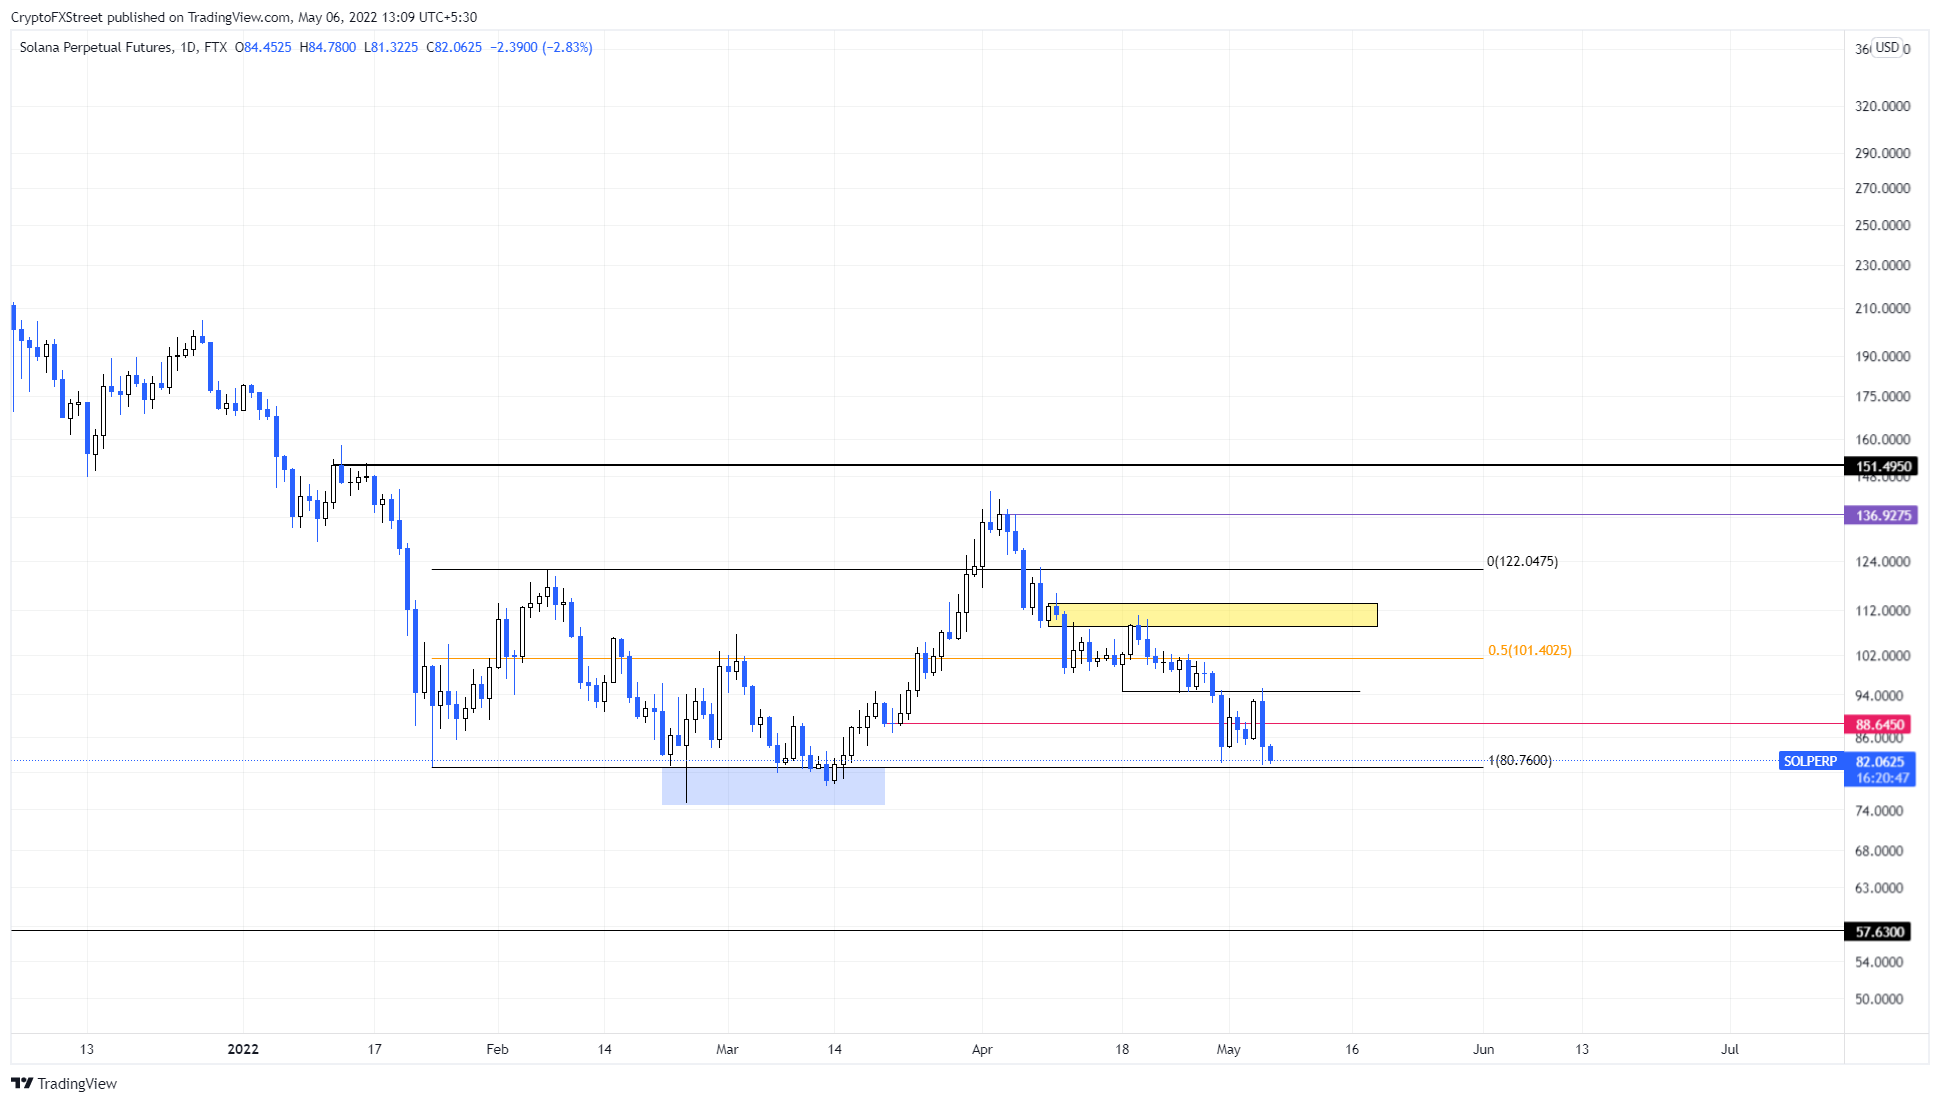
  • A failure to hold above $80 will lead to a 28% crash to $57.63.
  • A daily candlestick close above $94.64 will invalidate the bearish thesis.

Solana price shows that the buyers are struggling due to the recent downswing. A further spike in selling pressure could trigger a downtrend that could push it past an immediate support level and flip it into a hurdle in its path. 

Solana price at inflection point

Solana price range, stretching from $80 to $121 is facing another retest. This move comes after the recent sweep above the range high on April 1. Since then, SOL has nosedived roughly 43% and is currently retesting the lower limit at $80.

Although Solana price has tagged this hurdle on January 24 and swept below it on February 24, this downswing comes at a time when Bitcoin and the rest of the market are facing immense selling pressure.

A failure to hold above the $80 support level, therefore, will prove costly for bulls and SOL holders. A breakdown of the said level will trigger a 28% crash to the next foothold at $57. Here, buyers could accumulate SOL at a discount and trigger a new leg–up.
SOL/USDT 1-day chart

SOL/USDT 1-day chart

On the other hand, a spike in buying pressure that propels SOL to produce a daily candlestick close above $94.64 will create a temporary higher high. This development will skew the odds in the bulls’ favor and invalidate the bearish thesis. In this case, Solana price might make a run for the $108 to $113 supply zone.

Author

Akash Girimath

Akash Girimath is a Mechanical Engineer interested in the chaos of the financial markets. Trying to make sense of this convoluted yet fascinating space, he switched his engineering job to become a crypto reporter and analyst.

More from Akash Girimath
Share:

Editor's Picks

Bitcoin Weekly Forecast: BTC retreats as macro headwinds grow
Bitcoin (BTC) remains under pressure, down over 4% this week and trading around $76,900 at the time of writing on Friday. Institutional demand shows signs of weakness as spot BTC Exchange Traded Funds (ETFs) are on track to end their three-week inflow streak, recording nearly $500 million in net outflows through Thursday.
XRP falls toward key support as macro uncertainty, weak momentum cap recovery
Ripple (XRP) falls below $1.33 on Friday, marking the third consecutive day of declines. The token continues to track the broader cryptocurrency market downturn, with investors closely monitoring heightened macroeconomic uncertainty ahead of the United States (US) Consumer Price Index (CPI) release and next week’s Federal Reserve (Fed) monetary policy decision.
Crypto Today: Bitcoin, Ethereum, XRP stabilize at lower levels amid ETF outflows and macroeconomic risks
The broader cryptocurrency market is rising on Friday, with Bitcoin (BTC) trading above $77,000 after testing lower support near $76,500. Ethereum (ETH) shows signs of stability, hovering above the support provided at $2,400 despite capped upside at $2,500. Meanwhile, Ripple (XRP) holds above $1.33 after three straight days of declines, reflecting growing headwinds due to macroeconomic uncertainty.
Bitcoin pulls back as another golden cross fails to deliver
Earlier this week, Bitcoin formed a golden cross, a technical signal that occurs when the price’s 50-day moving average rises above the 200-day moving average and is conventionally viewed as a precursor to a bullish rally. Historically, however, that’s often not been the case.
Bitcoin: BTC retreats as macro headwinds grow
Bitcoin (BTC) remains under pressure, down over 4% this week and trading around $76,900 at the time of writing on Friday. Institutional demand shows signs of weakness as spot BTC Exchange Traded Funds (ETFs) are on track to end their three-week inflow streak, recording nearly $500 million in net outflows through Thursday.

