How this mean reversion will trigger 23% upswing for Solana price
- Solana price dug deeper below the 50% retracement level at $101.70 to sweep below the $88.65 barrier.
- A resurgence of buying pressure could trigger a 20% upswing to the $108.26 to $113.72 supply zone.
- A daily candlestick close below $80.76 will invalidate the bullish thesis.

Solana price has been in a downtrend since April 2 and shows signs of slowing down as it approaches the range low. A bounce around the current level, leading to recovery above the range’s midpoint is likely in the coming days.
Solana price readies for a quick run-up
Solana price has set up a range, extending from $80.76 to $121.52 as it rallied roughly 50% between January 24 and February 7. Since then, SOL has been trading inside these barriers with a few failed breakouts.
A range-bound asset is easy to read and trade; the asset often sweeps above/below a limit followed by a retest of the opposite level. For Solana price, the range low was first swept in February, which was followed by an 83% run-up that set a swing high at $143.64.
Buyers failed to maintain their momentum, however, which led to the eventual collapse of this uptrend. As of April 30, SOL lost roughly 43% of its market value and is currently hovering around the $88.65 barrier.
Going forward, investors can expect Solana price to trigger a run-up to retest the 50% retracement level at $101.70. The reason for this bullishness is due to the nature of ranging markets and the overall bullishness of the Bitcoin and crypto ecosystem. Clearing this hurdle could see SOL tag the lower limit of the $108.26 to $113.72 supply zone.
In total, this move would constitute a 23% ascent and is likely where the upside will be capped for the time being.
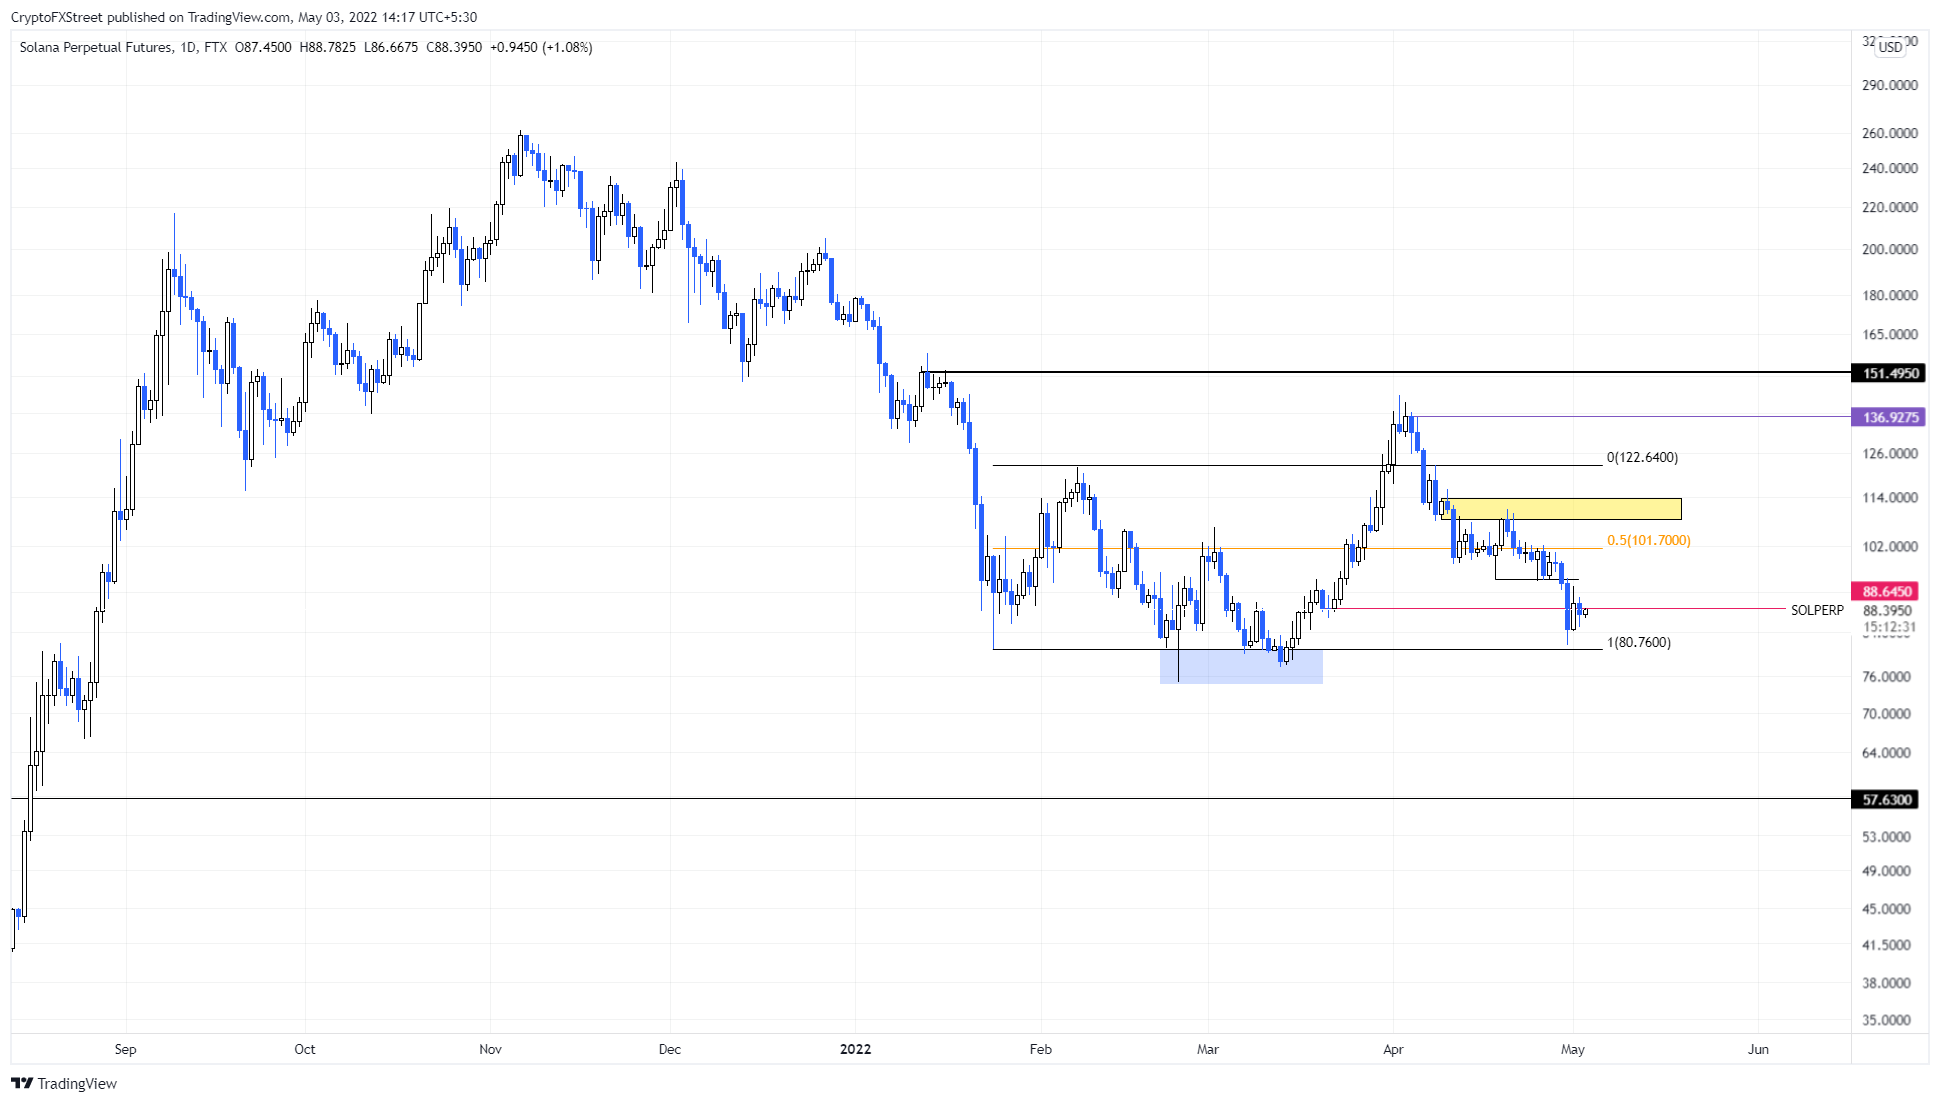
SOL/USDT 1-day chart
On the other hand, a sudden spike in selling pressure that produces a daily candlestick close below $80.76 will create a lower low and invalidate the bullish thesis. In such a case, SOL could crash 28% to tag the $57.63 support level.
Author

Akash Girimath
FXStreet
Akash Girimath is a Mechanical Engineer interested in the chaos of the financial markets. Trying to make sense of this convoluted yet fascinating space, he switched his engineering job to become a crypto reporter and analyst.


