- Solana price is stuck in a range, trading below the $102 to $104 support area.
- Investors can expect SOL to return to $135 after successfully flipping the $104 hurdle into support.
- A daily candlestick close below the range low at $80.76 will invalidate the bullish thesis for SOL.
Solana price has been consolidating below a stiff resistance barrier for quite some time. The recent uptick in buying pressure has pushed it above the said level, flipping it into a support floor. As a result, market participants can expect SOL to kick-start an explosive move to the upside.
Solana price awaits bulls’ comeback
Solana price is still stuck trading inside the range extending from $80.76 to $121.52. This boundary was formed after SOL rallied roughly 50% between January 24 and February 7. Rangebound moves are often simple to trade and usually involve a sweep above/below a limit followed by a retest of the other.
Likewise, Solana price swept the range low at $80.76 in February and rallied 83% to above the range high at $122.64. However, SOL extended well beyond the upper limit and set a swing high at $143.64.
The bearish market structure coupled with retail fear and profit-taking, however, resulted in a 32% correction that pushed Solana price back into the range and below the $102 to $104 support level and 50% retracement barrier at $101.70.
Since April 12, Solana price has been coiling up under these two crucial hurdles, awaiting a resurgence of buyers or bullish momentum to kick-start an upswing. As Bitcoin price begins a minor upswing, altcoins, including SOL, are likely to follow suit.
Hence, a surge in buying pressure that pushes SOL to flip the $104 hurdle into a support floor will trigger a 17% move to retest the range high at $121.52. In some cases, SOL bulls can extend the rally, allowing Solana price to tag daily candlestick closes at $136.92 formed on April 3 and 4.
This run-up, in total, would constitute a 35% gain from the current position at $101.19 and is likely where the upside will be capped for SOL.
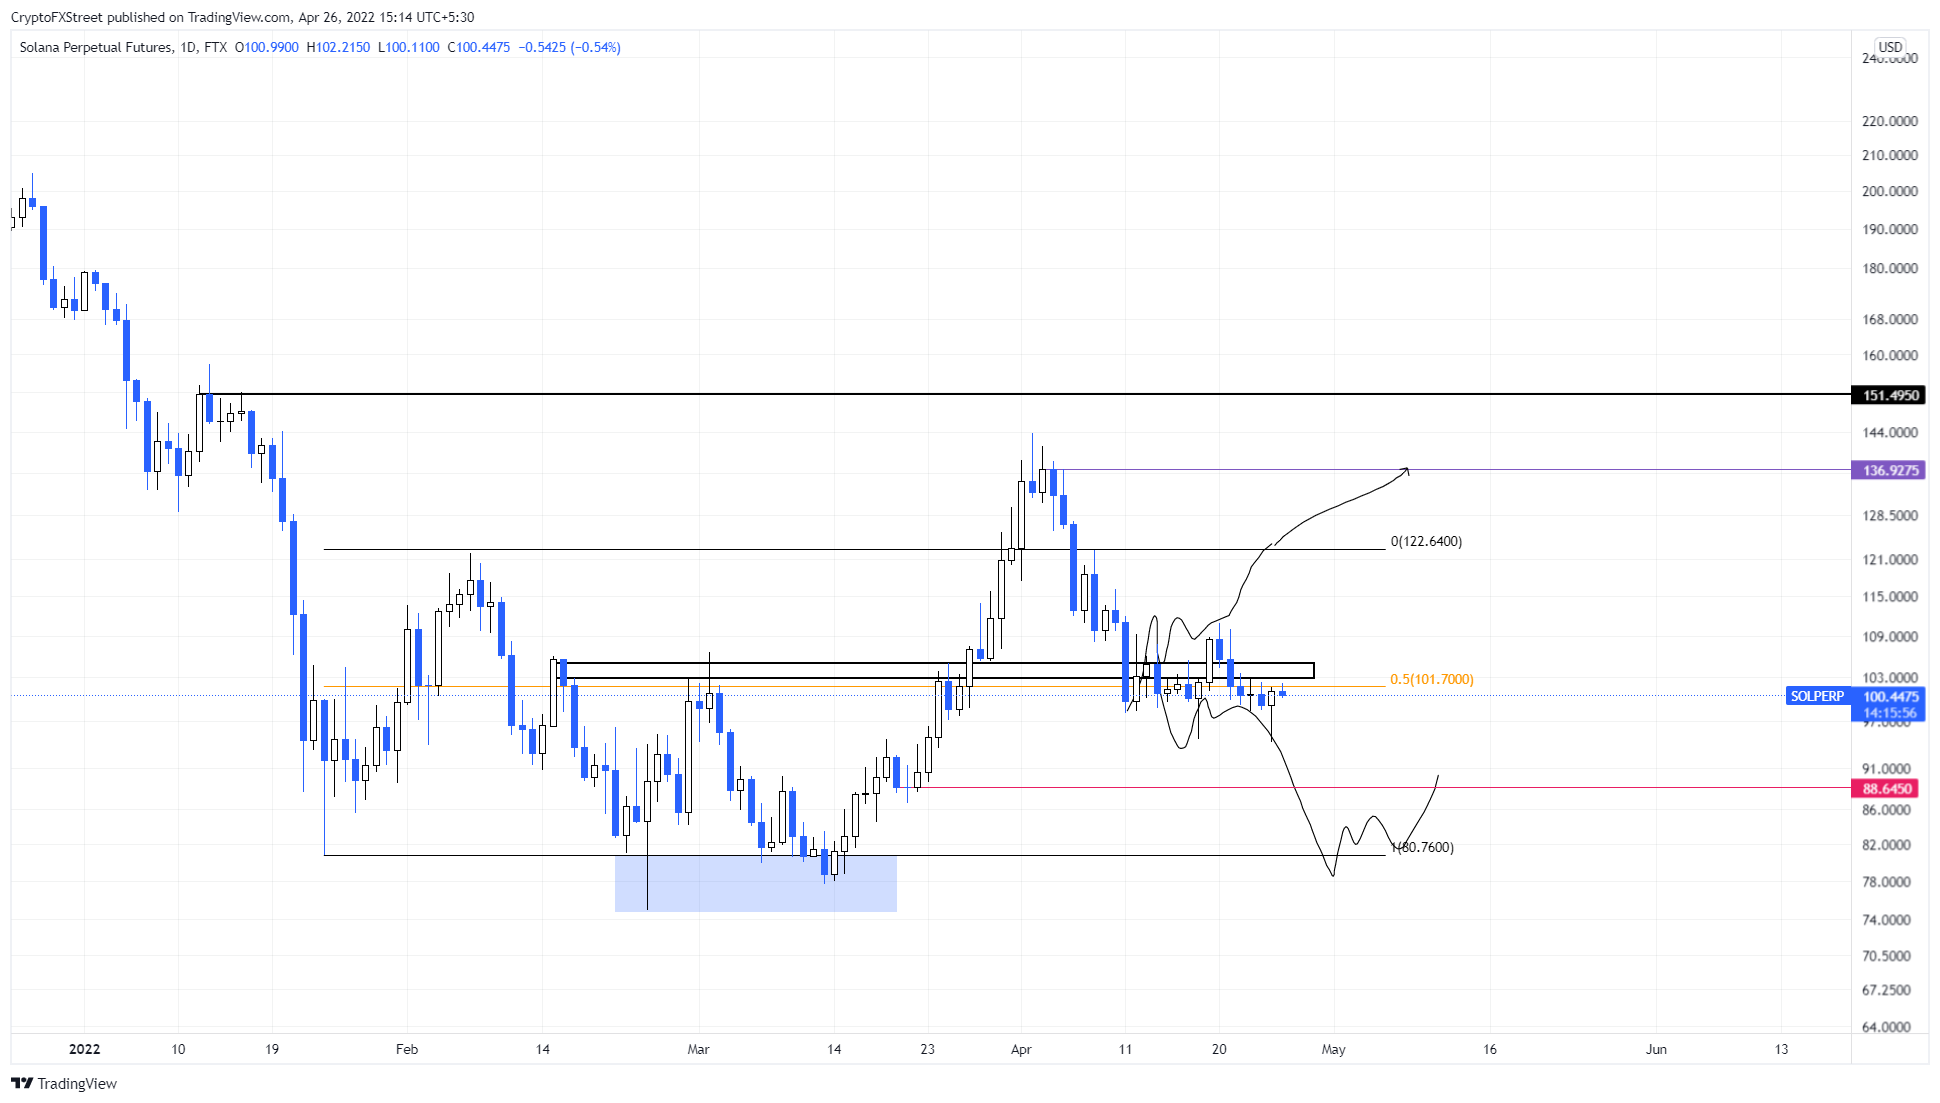
SOL/USDT 1-day chart
If Solana price produces a daily candlestick close below the range low at $80.76, it will create a lower low, skewing the odds in the bears’ favor and also invalidating the bullish thesis. In such a case, SOL could slide.
Information on these pages contains forward-looking statements that involve risks and uncertainties. Markets and instruments profiled on this page are for informational purposes only and should not in any way come across as a recommendation to buy or sell in these assets. You should do your own thorough research before making any investment decisions. FXStreet does not in any way guarantee that this information is free from mistakes, errors, or material misstatements. It also does not guarantee that this information is of a timely nature. Investing in Open Markets involves a great deal of risk, including the loss of all or a portion of your investment, as well as emotional distress. All risks, losses and costs associated with investing, including total loss of principal, are your responsibility. The views and opinions expressed in this article are those of the authors and do not necessarily reflect the official policy or position of FXStreet nor its advertisers. The author will not be held responsible for information that is found at the end of links posted on this page.
If not otherwise explicitly mentioned in the body of the article, at the time of writing, the author has no position in any stock mentioned in this article and no business relationship with any company mentioned. The author has not received compensation for writing this article, other than from FXStreet.
FXStreet and the author do not provide personalized recommendations. The author makes no representations as to the accuracy, completeness, or suitability of this information. FXStreet and the author will not be liable for any errors, omissions or any losses, injuries or damages arising from this information and its display or use. Errors and omissions excepted.
The author and FXStreet are not registered investment advisors and nothing in this article is intended to be investment advice.
Recommended Content
Editors’ Picks
Ripple's move above this key level could trigger nearly 50% rally for XRP
Ripple has overcome a critical resistance level and flipped into a support floor on the weekly time frame. This development happened while XRP tightly consolidated for roughly 250 days. Investors can expect XRP to kickstart a massive rally.
Optimism price outlook with nearly $90 million worth of OP tokens flooding markets on Friday
Optimism volatility has shrunk in the ours leading to the network’s cliff unlock. It joins the likes of dYdX and Sui, which have similar events on their calendars. As token unlocks are often considered bearish catalysts, investors should brace for a reaction after the event.
Top 3 Price Prediction Bitcoin, Ethereum, Ripple: Retail watches from the sidelines with a bias for shorts
Bitcoin could clear $73,777 peak as BTC bulls resurface. Ethereum might fall 10% before next leg up as ETH RSI teases with sell signal. XRP could lose $0.6000 threshold as Ripple bulls fail to show up.
Jito price could hit $6 as JTO coils up inside this bullish pattern
Jito price action shows a potential cup and handle formation. Based on theoretical measurement rules, a successful breakout could yield a 56% rally to $6.0. A breakdown of the $3.86 support level would create a lower low for JTO and invalidate the bullish thesis.
Bitcoin: BTC may have recovered, but is it out of the woods?
Bitcoin’s (BTC) upward momentum has shown a significant decline for the past two weeks or so. This development led to a bearish signal on the weekly and an uncertain outlook on the monthly.