BNB bulls target $700, anticipating Binance Coin will break this resistance level
- Binance Coin in a sideways pattern for over a week.
- Buyers look ready to attack the upper band of the range trade.
- A pop higher could mean a jump of 34% in the coming month.
Binance Coin (BNB) has been trading in a sideways pattern since the jump higher on August 23. During that day, price action broke $452 and tested $521. Since then, Binance Coin is range-trading between those two levels, a range that has been well-respected.
Buyers have spotted the solid entry-level at $452 on August 31. BNB is in the third consecutive day of gains and looks to test $521. If that level broke either on Thursday or Friday, it would open up some considerable upside potential.
Binance Coin buyers are in for a treat if they can break above $521
Breaking $521 to the upside would mean that Binance Coin sellers are getting pushed out of their position and buyers have seized complete control of the price action. To the upside, the monthly R1 resistance level at $554 will be the first pause in the trade before moving further upwards. The next level for profit-taking will be R2 resistance at $645. After that, the ultimate level will be $700 for buyers to fully close their long positions.
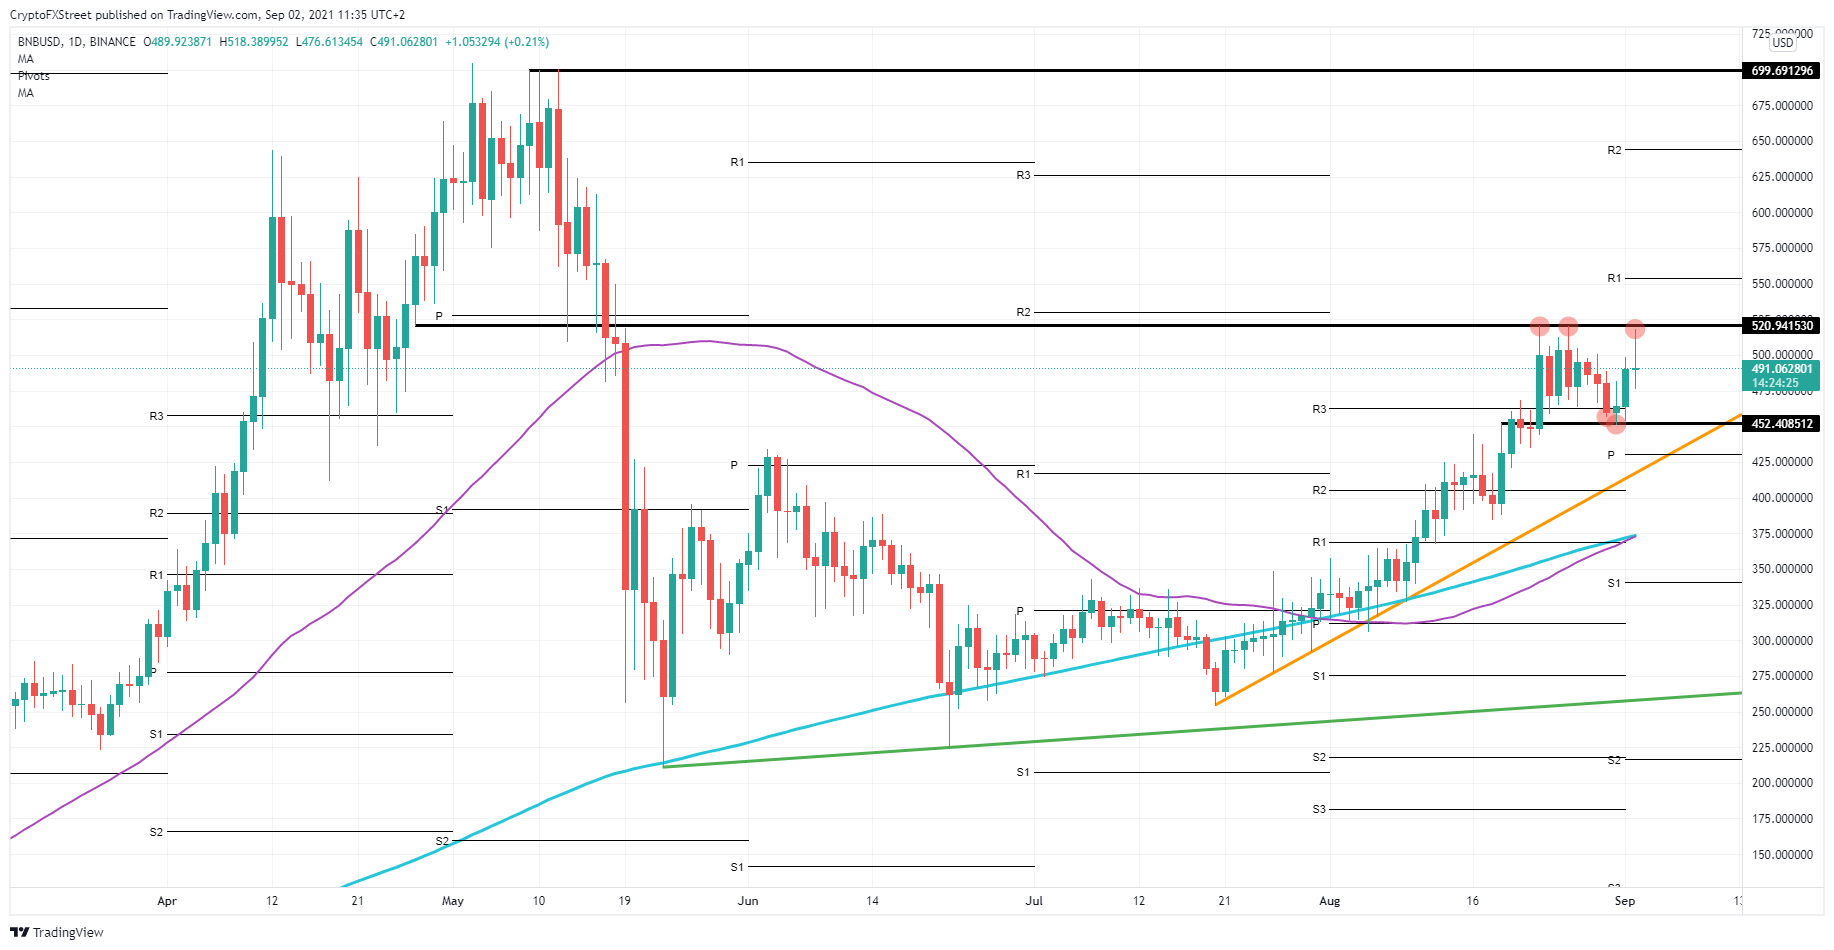
BNB/USD daily chart
Usually, the third time should be a charm, and it should be enough to break that $521 level. However, if sellers can overload buyers' demand, expect a dip lower, back again towards $452, the lower band of the range. BNB might then be stuck in this range for another few weeks until the orange ascending trend line comes into the mix, and becomes an additional force, making it a bullish triangle.
Further down, sellers will be looking at the monthly pivot at $425 as profit level for their shorts. But even then, the bullish trend still looks alive, with the orange ascending trend line as the backbone of the rally since August 21.
As an additional incentive, in favor of the buyers, the 55-day Simple Moving Average (SMA) and the 200-day SMA are on the verge of crossing each other. Another leg up in price action would form a golden cross and attract more sentiment buyers in Binance Coin.
Author

Filip Lagaart
FXStreet
Filip Lagaart is a former sales/trader with over 15 years of financial markets expertise under its belt.


