Bitcoin whales are buying the dip despite sell signals, and it makes sense
- Bitcoin price shed 10% in the last two weeks and shows signs that this trend will continue.
- Whales seem to be making a comeback and are looking to accumulate BTC should it slide lower.
- A flip of the $25,000 psychological level into a support floor will trigger a continuation of the uptrend to $30,000.

Bitcoin price shows a clear sign of exhaustion after its explosive move in 2023. The first leg of a downswing has begun, but further confirmation is required to know where BTC is headed. Whales, on the other hand, are on the move and poised to buy the dip.
Also read: How US CPI on Valentine's day could spell disaster for Bitcoin price
Bitcoin price hints at weakening structures
Bitcoin price produced a bearish divergence in the third week of January. After setting up a local top at $24,255, BTC has shed roughly 12% so far. The recent selling pressure pushed BTC to tag the 200-day Exponential Moving Average (EMA).
As a result of the continuous bearish daily candlestick closes, the Momentum Reversal Indicator (MRI) produced a green ‘one’ buy signal. This technical formation forecasts a one-to-four up candlesticks for the big crypto. However, since this buy signal is happening near the local top, the chances of it panning out are low.
Due to the support from the 200-day EMA and the inflation numbers announcement, there is bound to be a huge spike in volatility that could propel Bitcoin price to tag the bearish orderblock, aka supply zone, extending from $22,628 to $23,350. This area is a good place for short-sellers to start building up their positions.
The target for these short positions would be a retest of the 200-day Simple Moving Average (SMA) at $19,699.
While this short-term retracement might seem bearish, it is not. The 2023 bull rally produced a higher high above the November 5 swing high at $21,480, denoting a shift in the market structure on a daily timeframe. Technically, this move could be the start of an uptrend and the bearish case explained above is just a retracement before the bullish continuation.
Assuming this outlook plays out, the $18,199 support level, present just below the 200-day SMA, is a good place to start buying the dips.
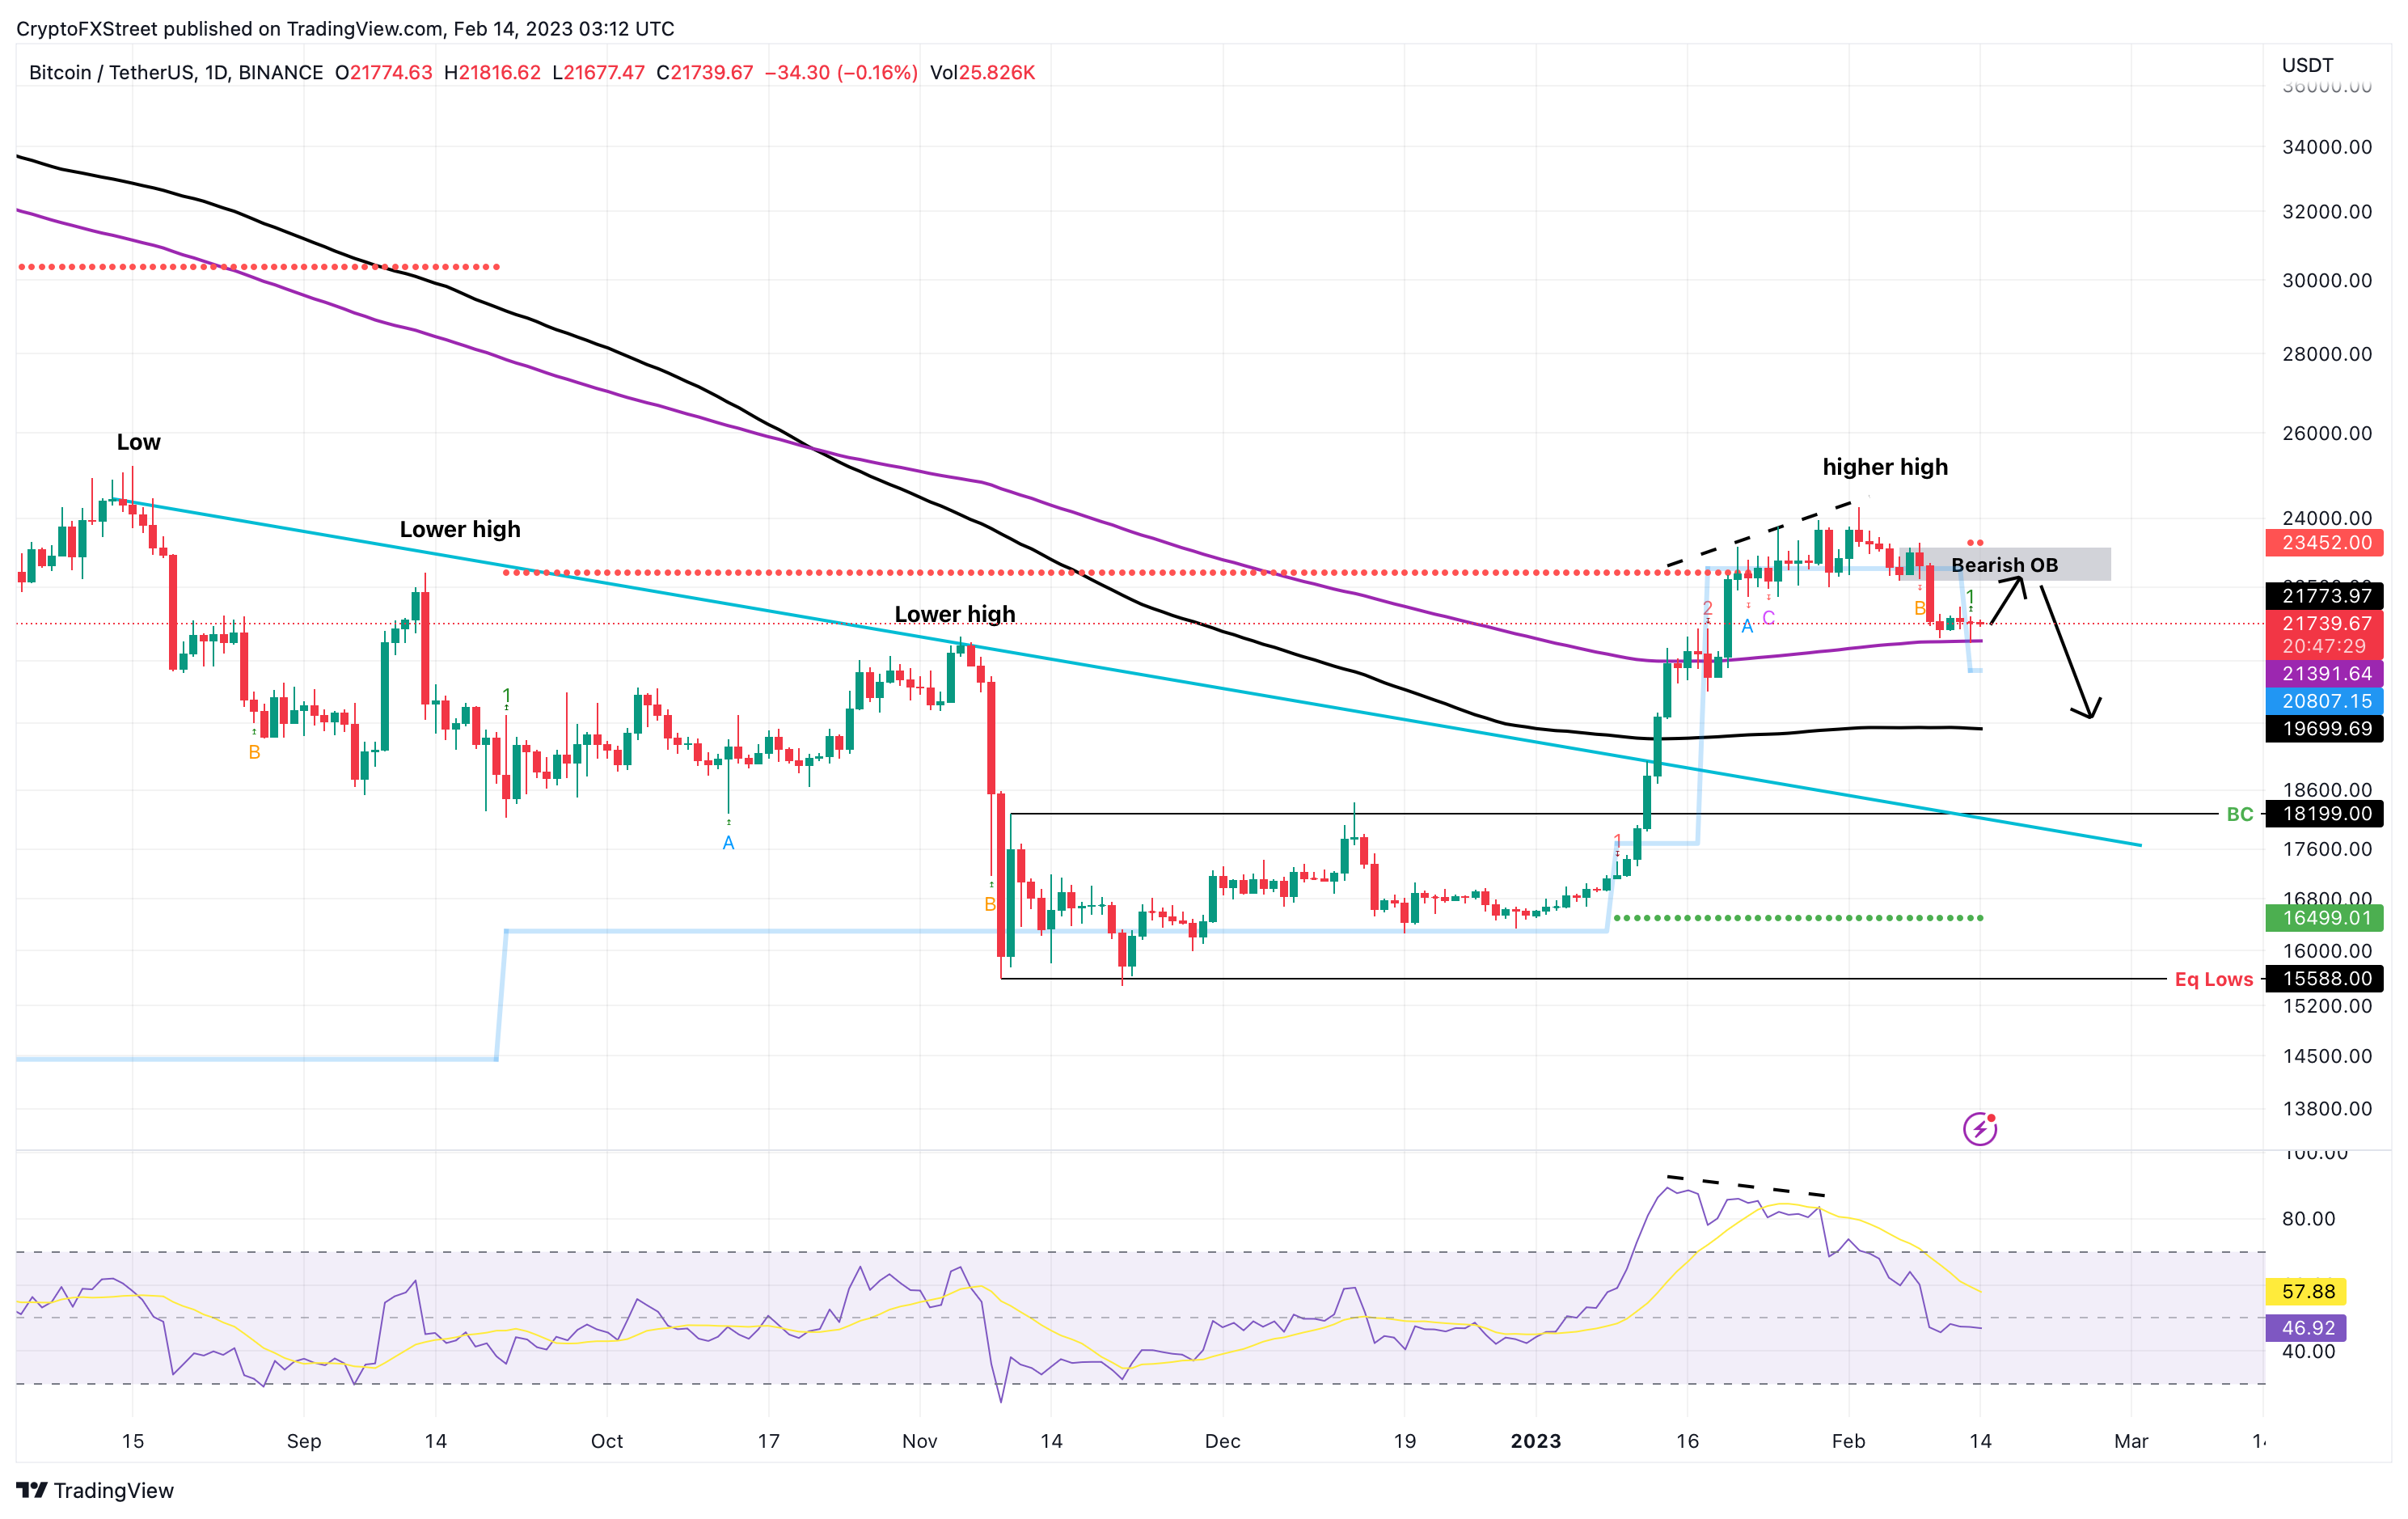
BTC/USDT 1-day chart
BTC whales are in a world of their own
While Bitcoin price has been tanking for the last two weeks, the Whale Transaction Count metric shows a considerable spike. These transactions worth $1,000,000 or more are considered as a proxy of whales or high net worth investors.
If these transactions are seen increasing after a rally, these whales are sending their tokens to book profits; hence it can be viewed as a sell signal. On the contrary, if this metric denotes a large spike after a sell-off, it would indicate that these high net worth investors are buying the dips.
Currently, the large transaction metric shows an uptick from 150 to 280 in the last five days.
 [08.48.05, 14 Feb, 2023]-638119431622335675.png)
BTC whale transaction count
To add more credence to whales’ behavior, investors can look at the gunpowder, aka stablecoins, these entities hold. The last time whales holding stablecoins spiked was in late December 2022, before BTC kick-started a 49% upswing in the following month.
Currently, Tether (USDT) and Circle (USDC) whales holding between 100,000 to 10,000,000 stablecoins have noted a stark spike in the last 48 hours.
 [08.56.59, 14 Feb, 2023]-638119431829228644.png)
BTC stablecoin whales
This uptick in whale transaction count, followed by an increase in stablecoin holdings, suggest one thing for investors - that high net worth investors are preparing to buy the dip. Extrapolating from these charts, one can assume that the sell signals noted from a technical perspective are ephemeral and will make way for the 2023 bull run to continue.
Author

Akash Girimath
FXStreet
Akash Girimath is a Mechanical Engineer interested in the chaos of the financial markets. Trying to make sense of this convoluted yet fascinating space, he switched his engineering job to become a crypto reporter and analyst.



