Bitcoin Weekly Forecast: Will BTC continue its ongoing decline?
- Bitcoin price hovers above the $58,700 level; a daily close below it would give further legs to the bearish trend.
- US spot Bitcoin ETFs registered three straight days of modest outflows this week, totaling $103.8 million.
- Bitcoin Exchange Netflow data shows 61,715.3 BTC were removed from exchanges and stored in the holders' wallets.
- On-chain data shows that BTC's Coinbase Premium Index is falling, and the Network Realized Profit/Loss spiked, contributing to the bearish bias.

Bitcoin (BTC) trades above $59,000 on Friday, but it has lost 7.5% this week so far after being rejected around the daily resistance of $65,000. The decline is supported by lower demand from the US spot Bitcoin ETFs, which registered a net outflow of $103.8 million, falling Bitcoin's Coinbase Premium Index, and a spike in Network Realized Profit/Loss. However, some investors seem to be taking the chance to buy BTC amid this price dip, as shown by the Exchange Netflow data.
US spot Bitcoin ETFs see modest outflow
Institutional flows didn't support Bitcoin price this week. According to Coinglass data, US spot Bitcoin ETFs experienced inflows at the start of the week, but saw three straight outflows until Thursday, totaling $103.8 million in net outflows. Net flows can help gauge investors' sentiment toward Bitcoin, but when these are small – like this week so far – they are less significant, considering that the total Bitcoin reserves held by the 11 US spot Bitcoin ETFs are at $43.38 billion.
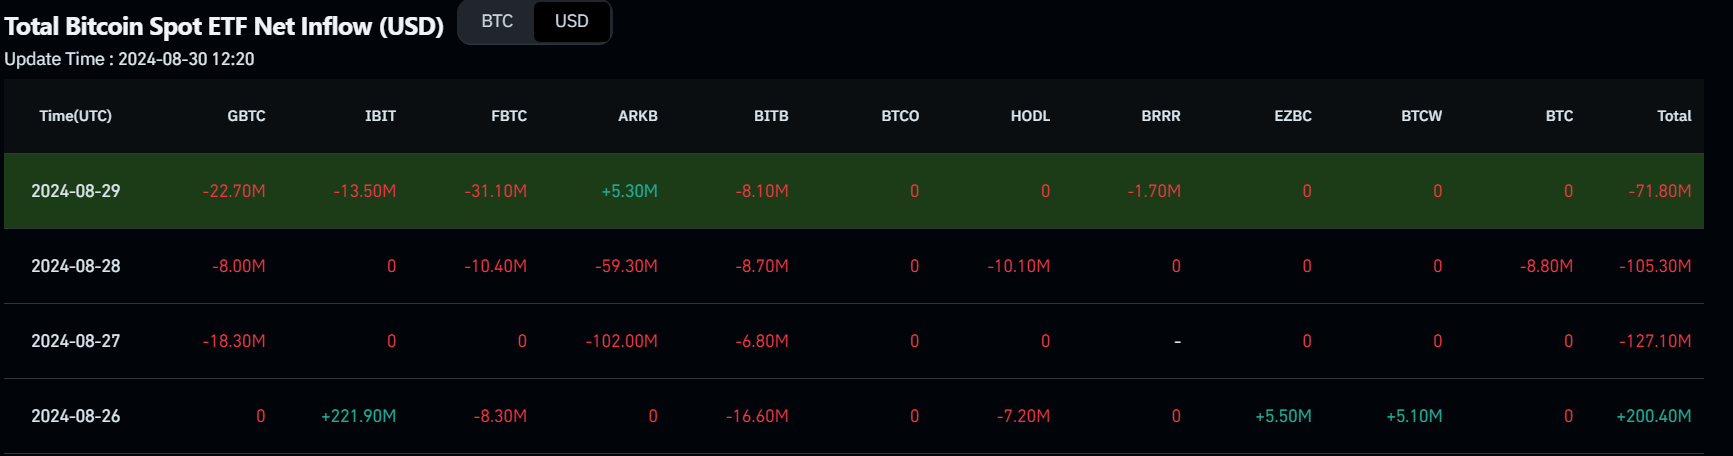
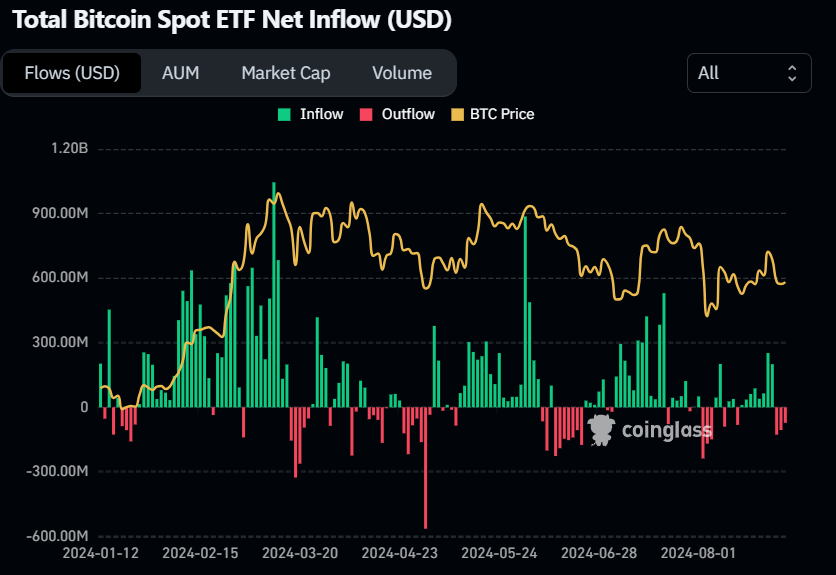
Bitcoin ETF Netflow chart
Bitcoin investors buy despite price decline
CryptoQuant Exchange Netflow data shows the difference between coins flowing into and out of exchanges. An increase in exchange inflows (a positive value) is mostly bearish, while an increase in outflows from exchanges (a negative value) is mostly bullish.
In BTC's case, the netflow until Thursday was -61,715.3 BTC, indicating that 61,715.3 BTC were removed from exchanges and stored in the holders' wallets despite Bitcoin's recent decline. This suggests buying activity and reducing selling pressure.
%20-%20All%20Exchanges%20(2)-638606093774756848.png)
Bitcoin Exchange Netflow chart
On-chain data shows negative bias
CryptoQuant's Bitcoin Coinbase Premium Index shows the gap between Coinbase Pro price (USD pair) and Binance price (USDT pair). Coinbase Premium data is one of the indicators that shows a sign of whale accumulation, as the Coinbase Pro platform is considered the gateway for institutional investors to purchase cryptocurrencies.
In the case of Bitcoin, the index fell from 0.077 to 0.009 from August 24 to August 29, trading below its 14-day Simple Moving Average (SMA) at 0.024. This indicates that whales are continuously selling at a lower premium. In addition, it shows a decrease in the interest and activeness of investors in Coinbase.
-638606094151544394.png)
Bitcoin Coinbase Premium Index chart
On-chain data provider Santiment's Network Realized Profit/Loss (NPL) indicator computes a daily network-level Return On Investment (ROI) based on the coin's on-chain transaction volume. Simply put, it is used to measure market pain. Strong spikes in a coin's NPL indicate that its holders are, on average, selling their bags at a significant profit. On the other hand, strong dips imply that the coin's holders are, on average, realizing losses, suggesting panic sell-offs and investor capitulation.
In BTC's case, the NPL indicator spiked from -32.99 million to 1.02 billion from Wednesday to Thursday. This positive uptick indicates that the holders were, on average, booking profits and increasing the selling pressure in BTC.
%20[14.20.02,%2030%20Aug,%202024]-638606094514393569.png)
Bitcoin Network Realized Profit/Loss chart
Will BTC continue its downtrend?
Bitcoin price was rejected around the daily resistance level at $65,379 on Sunday and has declined by 8% since the start of this week. At the time of writing, on Friday, it trades slightly up by 0.3% at $59,507.
If BTC continues to decline and closes below the $58,783 level, it could fall further by 4.5% to retest its daily support at $56,002.
The Relative Strength Index (RSI) and the Awesome Oscillator (AO) on the daily chart have slipped below their neutral level of 50 and zero, respectively. Both indicators suggest momentum is slightly weakening.
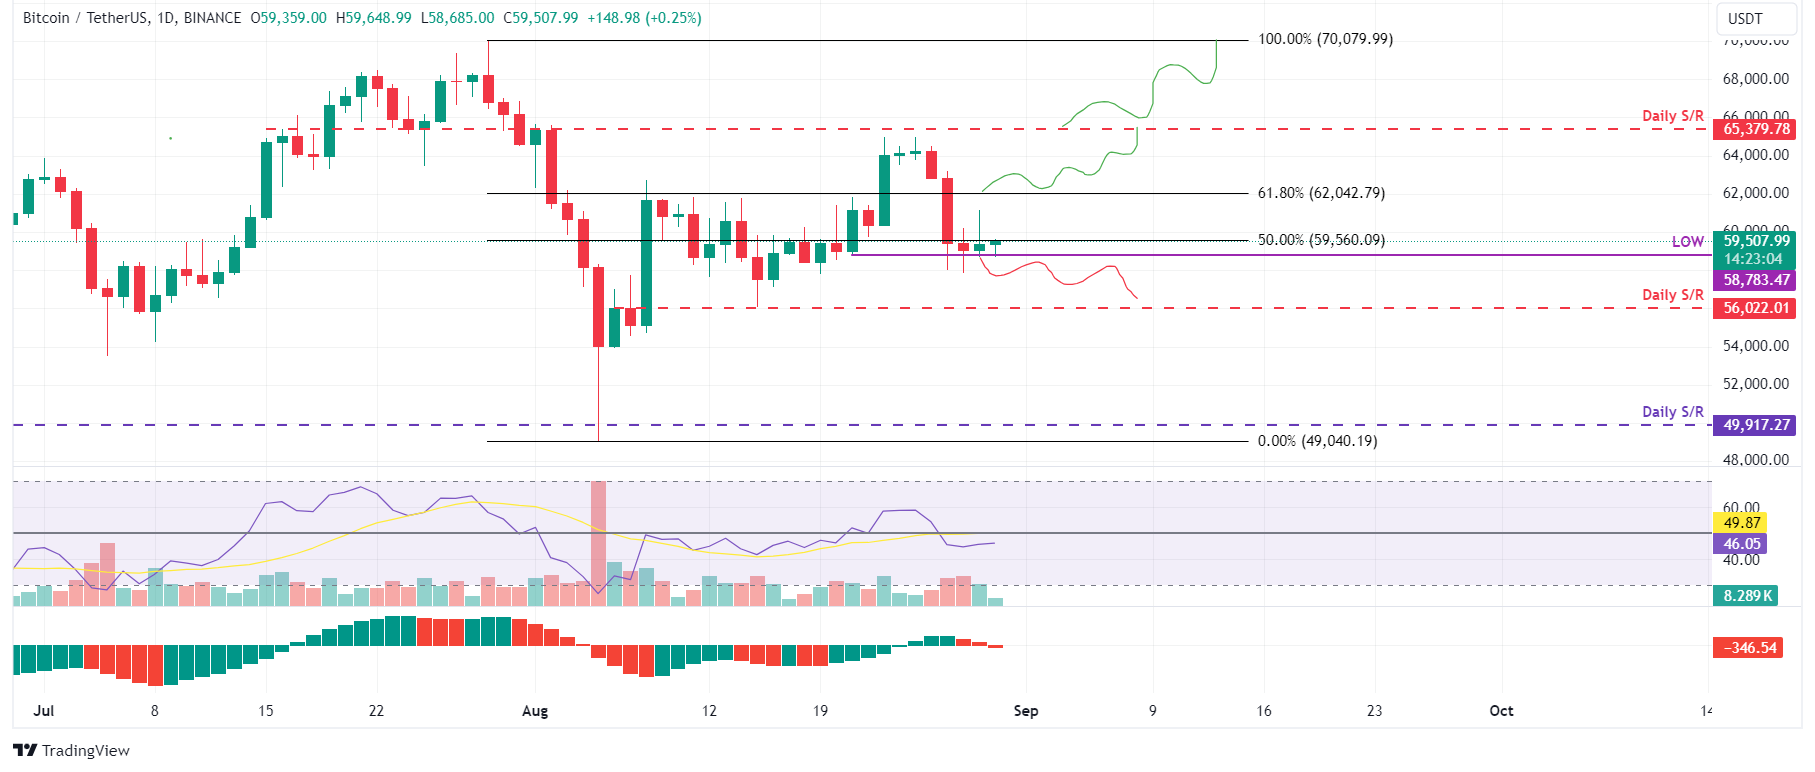
BTC/USDT daily chart
However, suppose Bitcoin's price finds support at around $58,700 and closes above $62,042, its 61.8% Fibonacci retracement level (drawn from a high in late July to a low in early August), the bearish thesis will be invalidated. In this scenario, BTC could rise by 5.5% to revisit its daily resistance level at $65,379.
Author

Manish Chhetri
FXStreet
Manish Chhetri is a crypto specialist with over four years of experience in the cryptocurrency industry.


