Bitcoin Weekly Forecast: These levels are ideal for Dollar cost averaging BTC after FTX crash
- Bitcoin price crashed 27% after the collapse of the FTX exchange and its subsidiaries in the first half of November.
- This development comes after crypto’s correlation to the stock market was waning, putting the BTC recovery rally in the backseat.
- A flip of the $19,100 hurdle could indicate that the bullish outlook is closer than anticipation.

Bitcoin price has faced the brunt of many industry leaders or significant platforms going bust in the last year. From Terra’s implosion to FTX’s bankruptcy, the industry seems shaken from a psychological perspective.
The latest development involves the Bahamian authorities seizing the digital assets from one of the FTX exchange’s subsidiaries.
As investors, an unbiased look reveals that the macro bottom is just one 20% crash away. With this narrative in mind, this week’s forecast takes a fresh look at significant levels and anticipates other scenarios that may evolve for Bitcoin price.
Bitcoin and stock market correlation drops in an unexpected way
After the 2020 COVID situation, the Crypto market saw a spike in the 90-day correlation with the S&P 500, the main US stock market index. This relationship between the two assets only strengthened going forward and hit an all-time high of 0.644 roughly two-to-three months ago.
Lately, this correlation has seen a sharp decline since September 24 from 0.644 and has dropped to 0.519 in a month. In the first week of November, however, things began to escalate between Binance and FTX. The tussle between the two crypto behemoths eventually led to a major selloff of the FTX exchange’s native token, FTT, which led to a chain reaction that ended in the latter exchange’s bankruptcy.
As a result, the 90-day correlation has seen a nosedive from 0.519 to 0.435. This sudden yet relative decline indicates that the crypto markets are not currently taking major cues from the United States stock market. However, this value of correlation is still too high and indicates that a further collapse in the stock markets could also trigger a similar fate for the big crypto.
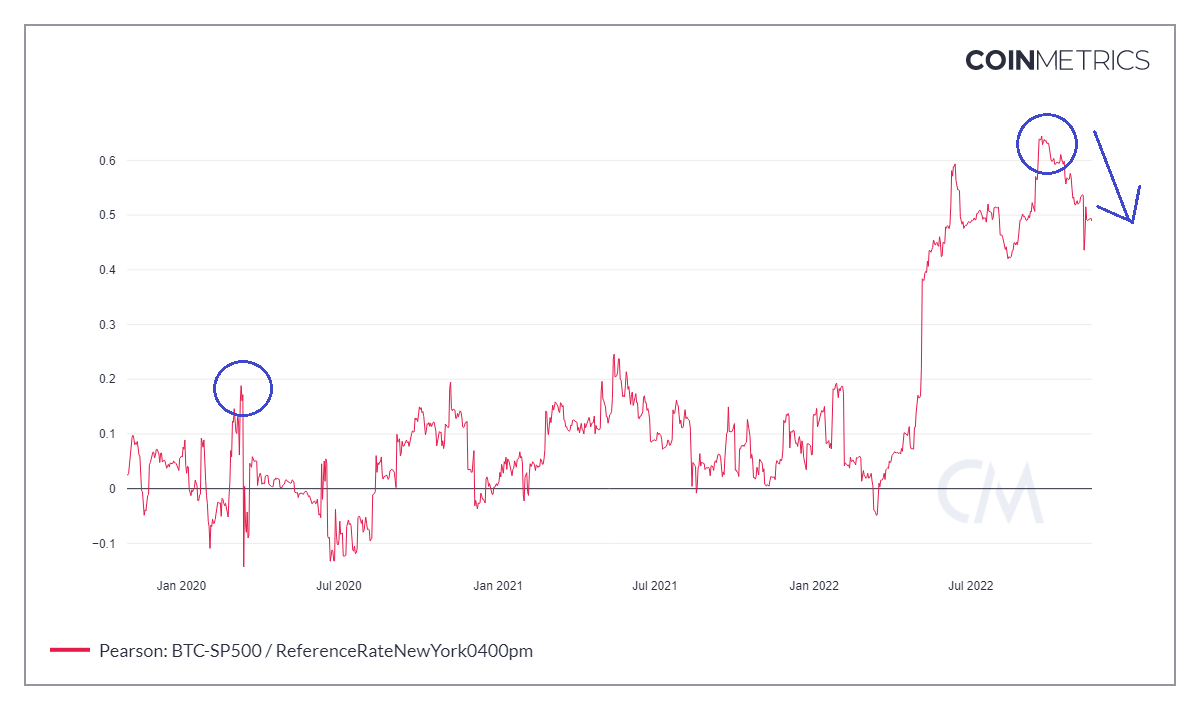
BTC vs. S&P500 correlation chart
Bitcoin price and its changing narratives
Bitcoin price has been predominantly bearish due to the collapse of crypto companies over the last year. The fact that this wave of bankruptcy is happening after BTC hit an all-time high of $68,789.63 makes it much more compelling to believe that it is a full-blown bear market.
Although the altcoins have been an outlier in certain conditions, the general direction of the market is bearish. Coming to the big crypto, it seems to be forming a massive falling wedge pattern, which brings our previous forecasts on Bitcoin’s potential macro bottom levels together.
This setup was formed as Bitcoin price produced two distinctive lower highs and three lower lows between July 2021 and November 2022. Connecting these swing points using trend lines reveals a falling wedge pattern, which forecasts a 54% upswing to $32,191. The target is obtained by adding the distance between the first swing high and swing low to the breakout point at $20,561.
This development is extremely significant and interesting due to two reasons.
If Bitcoin price produces a macro bottom at $13,575, it will denote a 71% crash from $48,100. The midpoint of this nosedive is $32,191, which is also the target forecasted by the falling wedge.
The initial confirmation of an uptrend will arrive if BTC manages to flip the highest traded volume level of 2022 at $19,150. However, a three-day candlestick close above $20,560 would be needed to confirm a decisive breakout of the falling wedge setup and kick-start a potential 54% upswing.
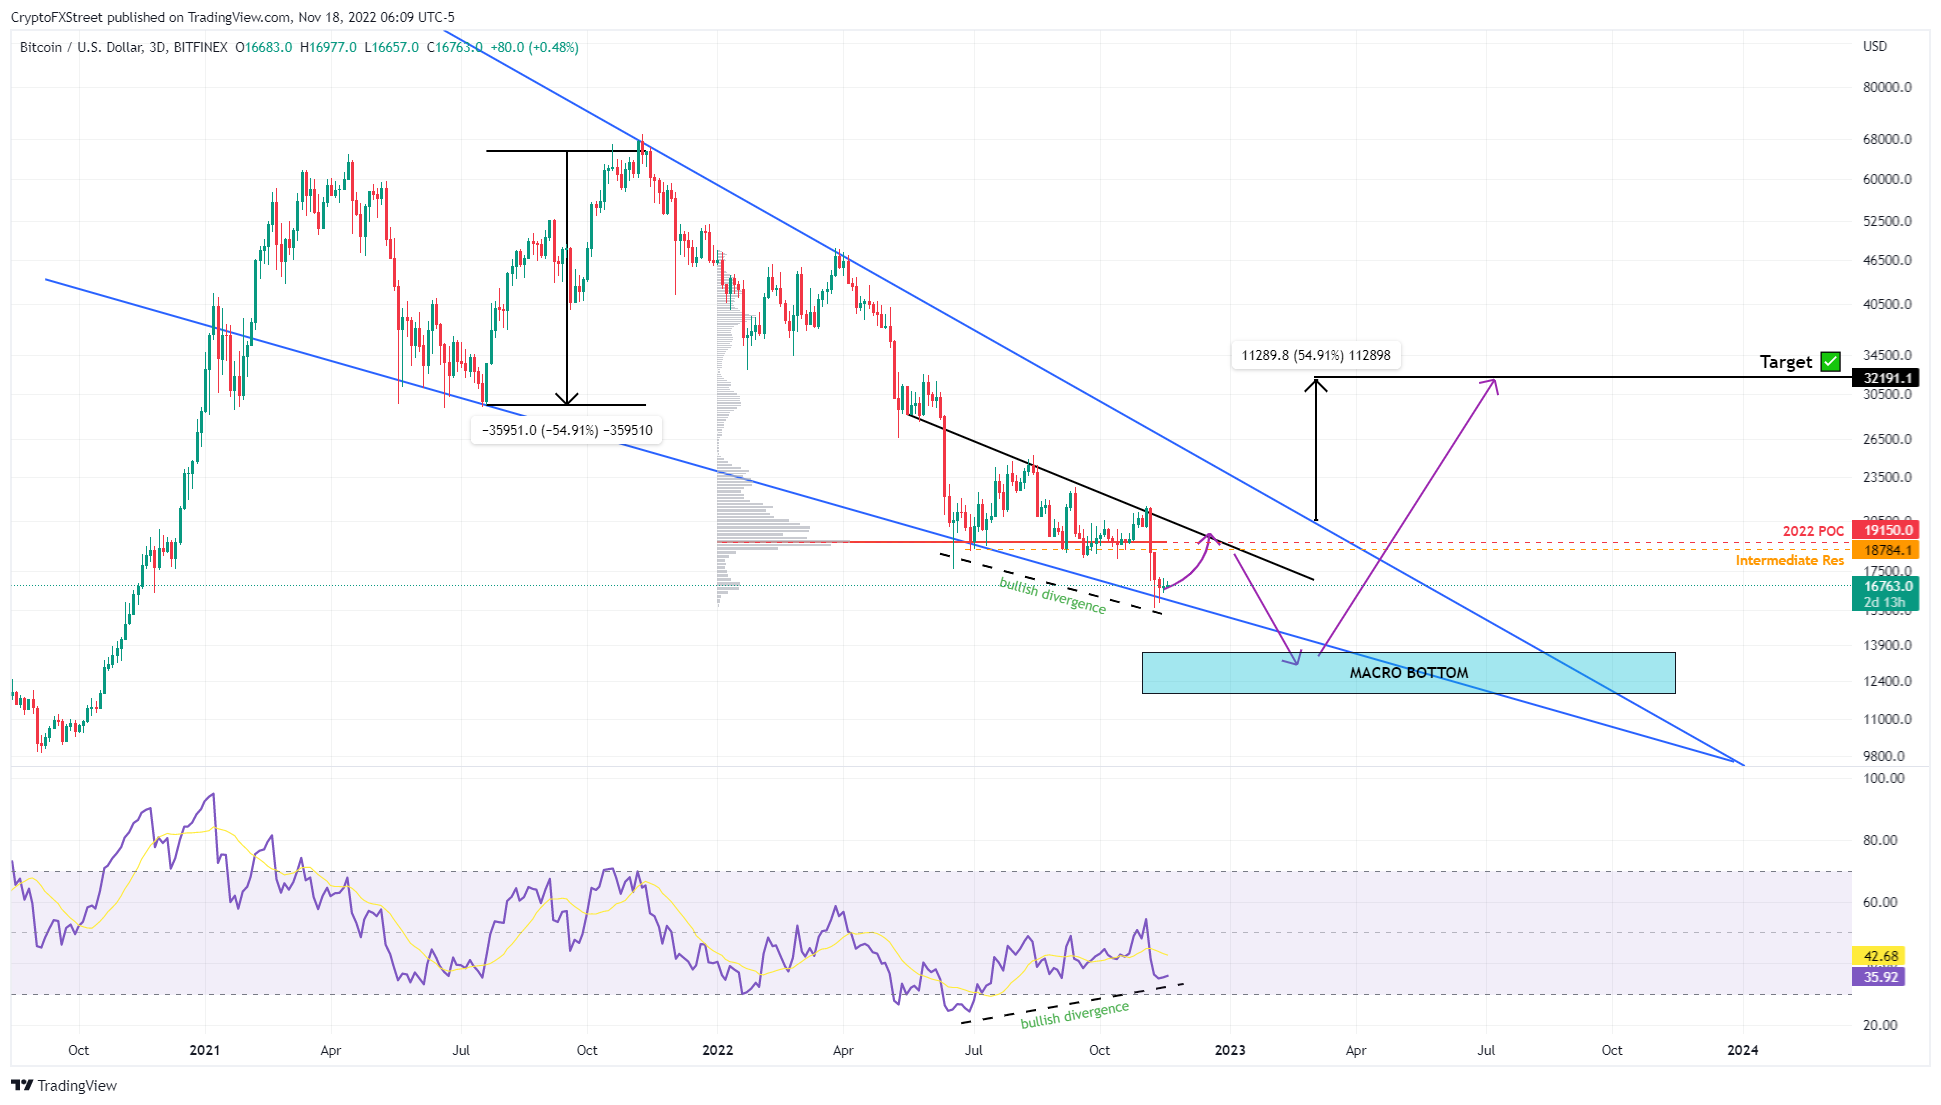
BTC/USDT 1-day chart
Timing your BTC investment
While these tidbits are thought-provoking, investors need to know which levels are important to kick-start their investment journey.
Before diving into the obvious levels, market participants should note that there is non-conformity between the Relative Strength Index (RSI) momentum indicator, which has produced higher lows, and the Bitcoin price action from June 21 has set up lower lows. This formation is termed a bullish divergence and hints that Bitcoin price will soon reflect the spike in momentum by triggering a run-up.
So, traders who are expecting a straight flush to the macro bottom levels, extending from $13,575 to $11,898, should be careful. The bullish divergence could trigger a 16% rally to the immediate hurdles at $18,784 or $19,150.
Investors should also exercise caution and keep their emotions in check, as this run-up could trigger FOMO and lead to terrible investment decisions.
Ideal levels to invest will arrive with a confirmation.
- If Bitcoin price crashes below the falling wedge’s lower trend line at $15,500, investors should start Dollar cost averaging, aka buying the dips with small and fixed amounts of capital. The significant levels include $13,575 and $11,898. While a steeper correction is unlikely, a revisit of the $10,000 psychological level should not catch investors off guard.
- Due to the bullish divergence, investors that are impatient can start accumulating BTC at these levels. However, increasing the investment size or capital allocation should be considered only after a flip of the 2022 POC at $19,150. A failure to overcome this hurdle will be a telltale sign for market participants to start offloading their holdings.
Since it is too soon to predict which direction Bitcoin price will choose, there is no invalidation thesis per se. That said, the falling wedge pattern and its expectations will come undone if Bitcoin price produces a lower low below the November 8 lows at $15,500.
Author

Akash Girimath
FXStreet
Akash Girimath is a Mechanical Engineer interested in the chaos of the financial markets. Trying to make sense of this convoluted yet fascinating space, he switched his engineering job to become a crypto reporter and analyst.


