- Bitcoin price shows a bearish outlook on a three-day chart with targets ranging from $13,575 to $11,898.
- Lower time frame analysis shows BTC is ready to trigger a recovery rally attempt to retest $17,251.
- A flip of the $17,593 hurdle into a support level will question bears’ authority and could trigger a bullish move.
Bitcoin price has breached a stable support level that has prevented a collapse for the last four months. This development has knocked BTC down to retest some not-so-great footholds that could trigger a further crash in market value for the big crypto holders.
Bitcoin price remains indecisive
Bitcoin price slipped below the June 18 support level at $17,593 on November 8. This collapse was a result of the FTX exchange’s dilemma, which eventually led to bankruptcy. Although trouble for the Bahama-based platform began on November 2, the situation worsened in the coming days.
This caused the crypto market to tumble and Bitcoin price to flip the $17,593 support into a resistance level. As BTC auctions at $16,000, investors need to pay attention to $15,551, which is a decent support zone and was formed roughly two years ago.
A failure to hold above this level will further push Bitcoin price to the subsequent foothold at $13,575, which is also relatively weak, especially when compared to $11,898.
Therefore, from a macro perspective, a bear market bottom could occur anywhere between $11,898 and $13,575. So, investors need to be wary of Bitcoin price’s short-term bounces and not be lured by it.
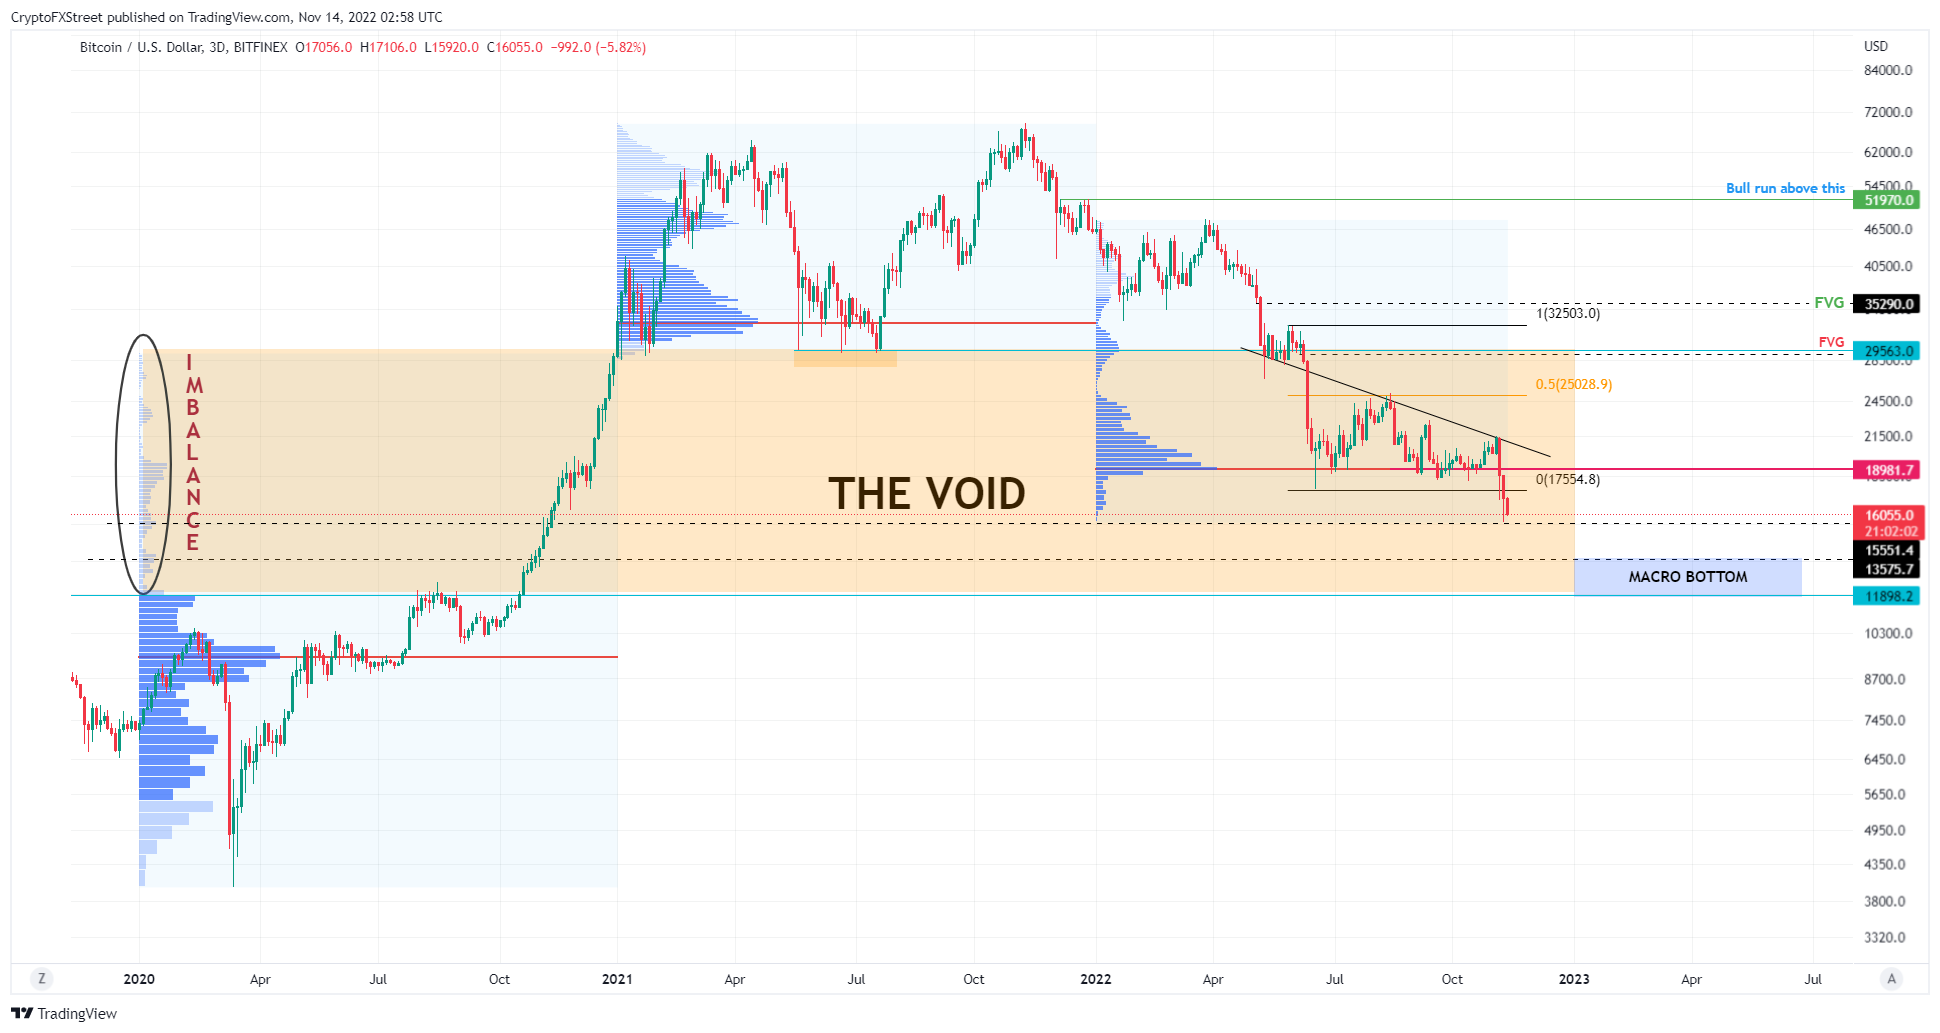
BTCUSDT 3-day chart
While the Asian session is not off to a bullish start, the London or the New York sessions could result in a spike in buying pressure. Therefore, investors need to be cautious of intra-day Bitcoin price moves for scalping opportunities.
On the one-hour chart, investors can see that Bitcoin price is hovering above a 30-minute demand zone, extending from $15,550 to $15,924. A bounce off this level could be key in triggering an 8% upswing that retests the inefficiency known as the Fair Value Gap (FVG) at $17,251.
Only a flip of the $17,593 hurdle will invalidate the bearish bias and extend this run-up’s target from $17,251 to $19,500.
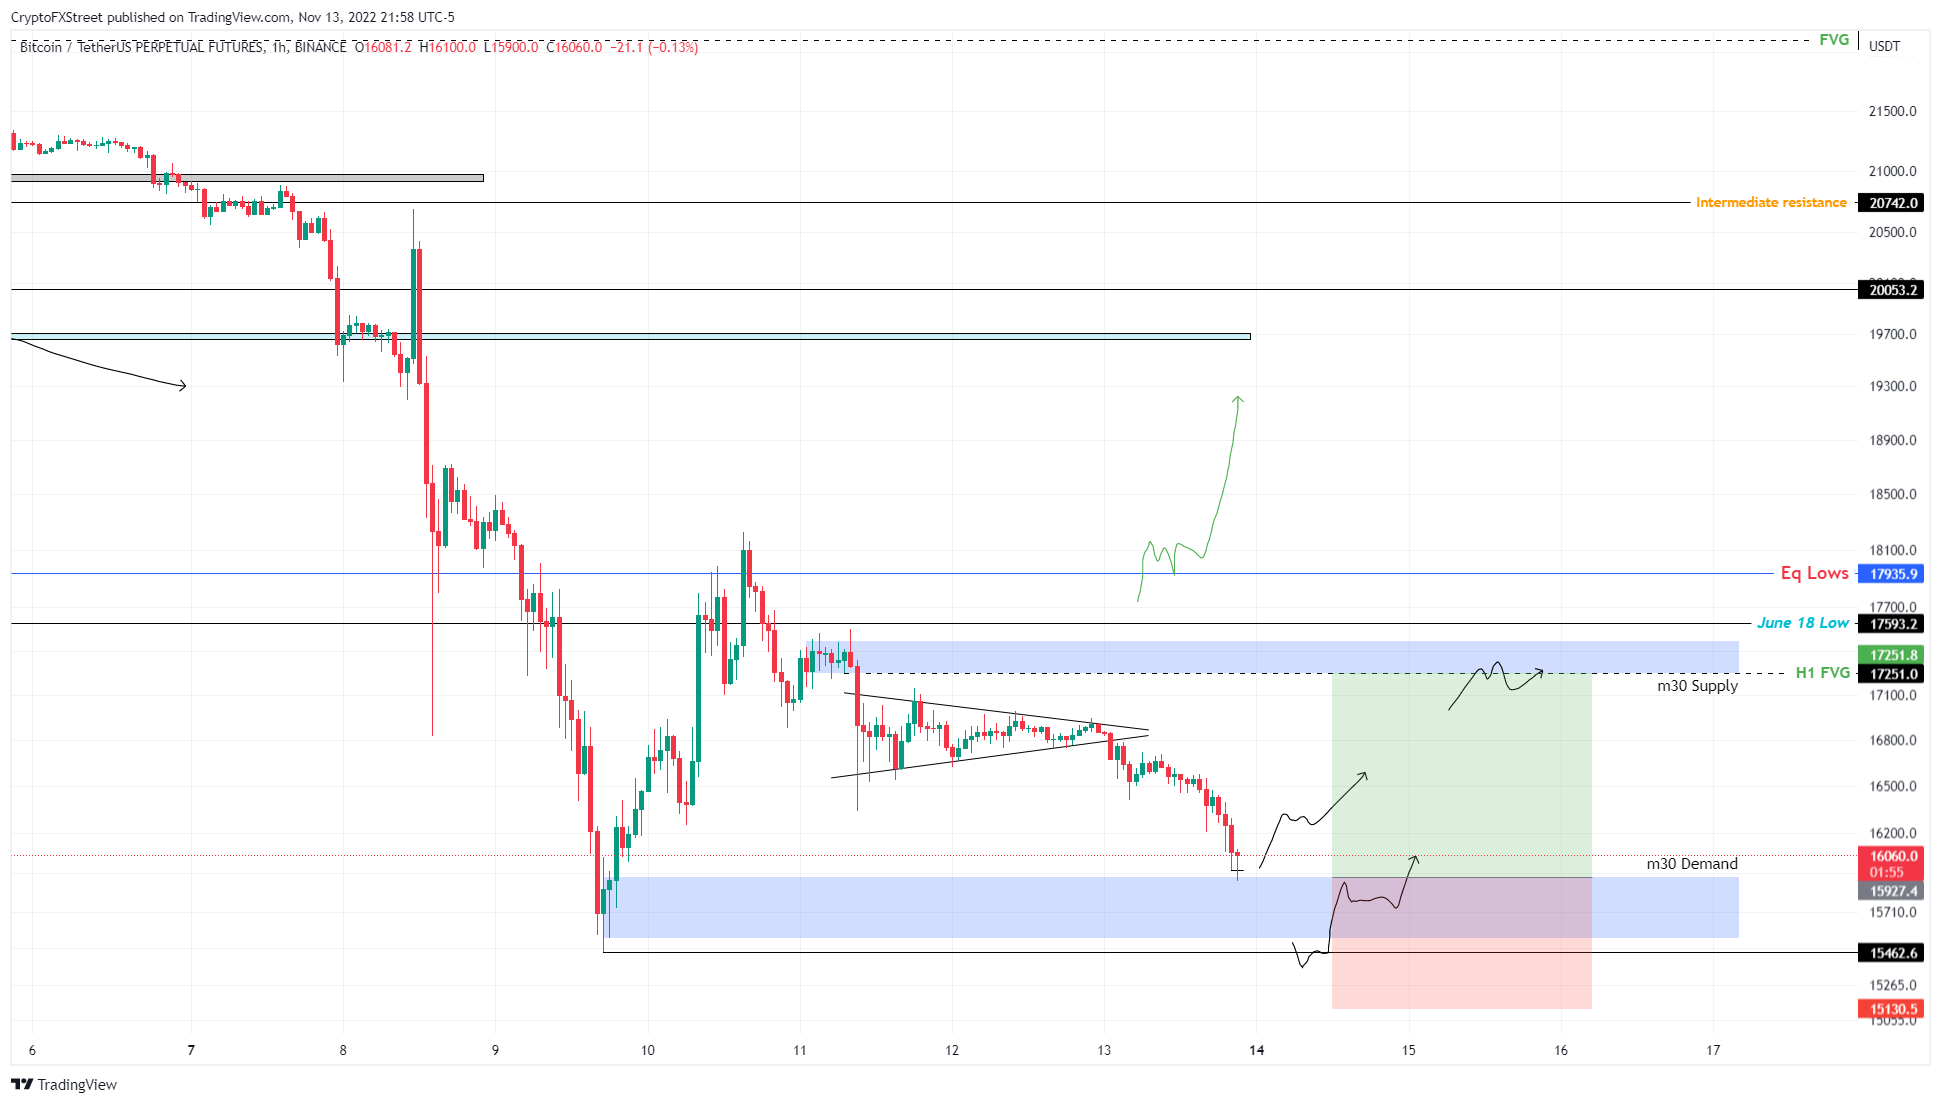
BTCUSD 1-hour chart
While things are looking bearish in the long term, a flip of the $17,593 level would be a start of a recovery rally. This development would also invalidate the bullish theiss and potentially trigger a run-up to the $25,000 psychological level.
Information on these pages contains forward-looking statements that involve risks and uncertainties. Markets and instruments profiled on this page are for informational purposes only and should not in any way come across as a recommendation to buy or sell in these assets. You should do your own thorough research before making any investment decisions. FXStreet does not in any way guarantee that this information is free from mistakes, errors, or material misstatements. It also does not guarantee that this information is of a timely nature. Investing in Open Markets involves a great deal of risk, including the loss of all or a portion of your investment, as well as emotional distress. All risks, losses and costs associated with investing, including total loss of principal, are your responsibility. The views and opinions expressed in this article are those of the authors and do not necessarily reflect the official policy or position of FXStreet nor its advertisers. The author will not be held responsible for information that is found at the end of links posted on this page.
If not otherwise explicitly mentioned in the body of the article, at the time of writing, the author has no position in any stock mentioned in this article and no business relationship with any company mentioned. The author has not received compensation for writing this article, other than from FXStreet.
FXStreet and the author do not provide personalized recommendations. The author makes no representations as to the accuracy, completeness, or suitability of this information. FXStreet and the author will not be liable for any errors, omissions or any losses, injuries or damages arising from this information and its display or use. Errors and omissions excepted.
The author and FXStreet are not registered investment advisors and nothing in this article is intended to be investment advice.
Recommended Content
Editors’ Picks
Top 5 tokens trending alongside Bitcoin: ORDI, STX, LUNC, PEPE, CFX

Bitcoin price crossed the $41,400 level early on Tuesday. The largest cryptocurrency by market capitalization extended its gains and continued its rally, after yielding 12% weekly gains for holders.
There is a 25% probability of Solana flipping Ethereum: Santiago Santos

In a recent episode of the Empire podcast, Santiago Santos, former Partner at ParaFi Capital, shares his views on how Solana’s market capitalization could exceed Ethereum’s in the next market cycle.
Ripple transaction count exceeds 1.38 million, XRP price likely to extend gains

Ripple (XRP) remains a talking point among retail market participants that expect a settlement in the US Securities and Exchange Commission’s (SEC) lawsuit against the cross-border payment remittance firm.
Bitcoin price eyes $45,000 target ahead of BTC halving in April 2024

Bitcoin price crossed the $41,400 mark on Binance, in its ongoing uptrend, on December 5. BTC price rally is likely driven by the anticipation of Spot Bitcoin ETF approval. There are more catalysts driving BTC price gains in the current cycle.
Analyzing potential $30k corrections ahead of BTC ETF approval

Bitcoin has slowed down its 2023 bull rally as it approaches the $37,000 level. After three weeks of consolidating around this level, BTC shows no directional bias whatsoever. Some investors speculate this could be an upward-sloping accumulation that leads to a $40,000 rally.