Bitcoin Weekly Forecast: BTC history forecasts another crash in Q3 ahead of Jackson Hole Symposium
- Bitcoin price history suggests the August 17 sell-off will likely extend.
- Investors can expect a retest of $20,000 should this outlook play out.
- On-chain metric hints more pain ahead for both short and long-term holders.
- The Jackson Hole Symposium on August 25 could trigger an ephemeral volatile spike in BTC and stocks.

Bitcoin price shows a slow sideways movement around the $26,000 level after an outburst of volatility on August 17. This sideways movement could face a further decline should history rhyme.
Read more: Bitcoin price holds at $26,100 range ahead of Jerome Powell’s Speech at Jackson Hole Symposium
Bitcoin price history provides a clue on what to expect
Bitcoin price history for the past 12 years gives a lot of clues for those who pay attention. The higher timeframe picture is critical for this type of analysis. The weekly BTC chart has very few instances where the Relative Strength Index (RSI), which tracks the momentum of Bitcoin price, has slipped below the 50 mean level. Identifying the impact of this move provides a hint for investors on what to expect.
The table attached below shows that Bitcoin price has crashed massively in the days leading up to the breakdown of the weekly RSI’s mean level. On average, BTC loses 40.15% of its value from the most recent peak to the point of the breakdown. The highest loss recorded was in February 2020, when the pioneer crypto lost 61% of its value in less than a month. The smallest drop was noted in September 2019, where BTC shed only 25%.
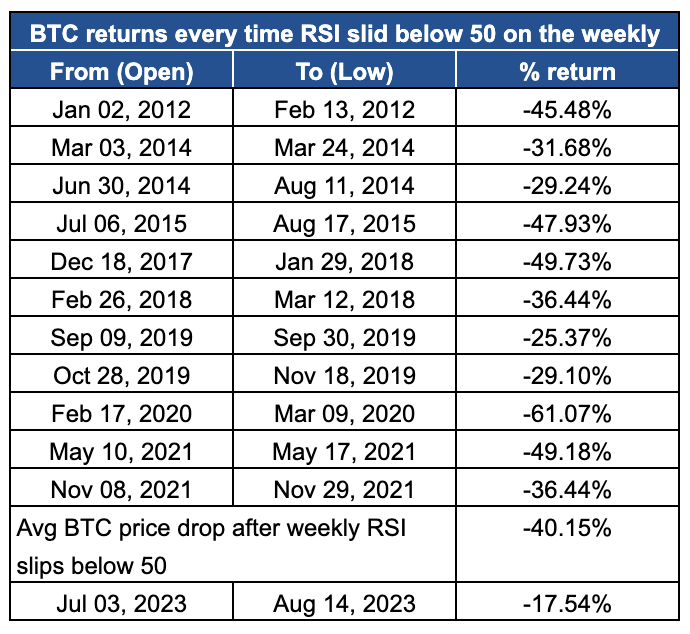
BTC price crashes based on RSI
At present, Bitcoin price has dropped 17.54% from its most recent peak in July as the weekly RSI fell below the 50 level. If this is BTC setting up a new low, then investors have nothing to worry about. But if there is more blood to be shed, it is likely that Bitcoin price will follow through and extend the losses of the August 17 crash.
Assuming a 40% slump, Bitcoin price would not only shatter the $20,000 psychological level but dip roughly $2,000 lower and retest $18,282.
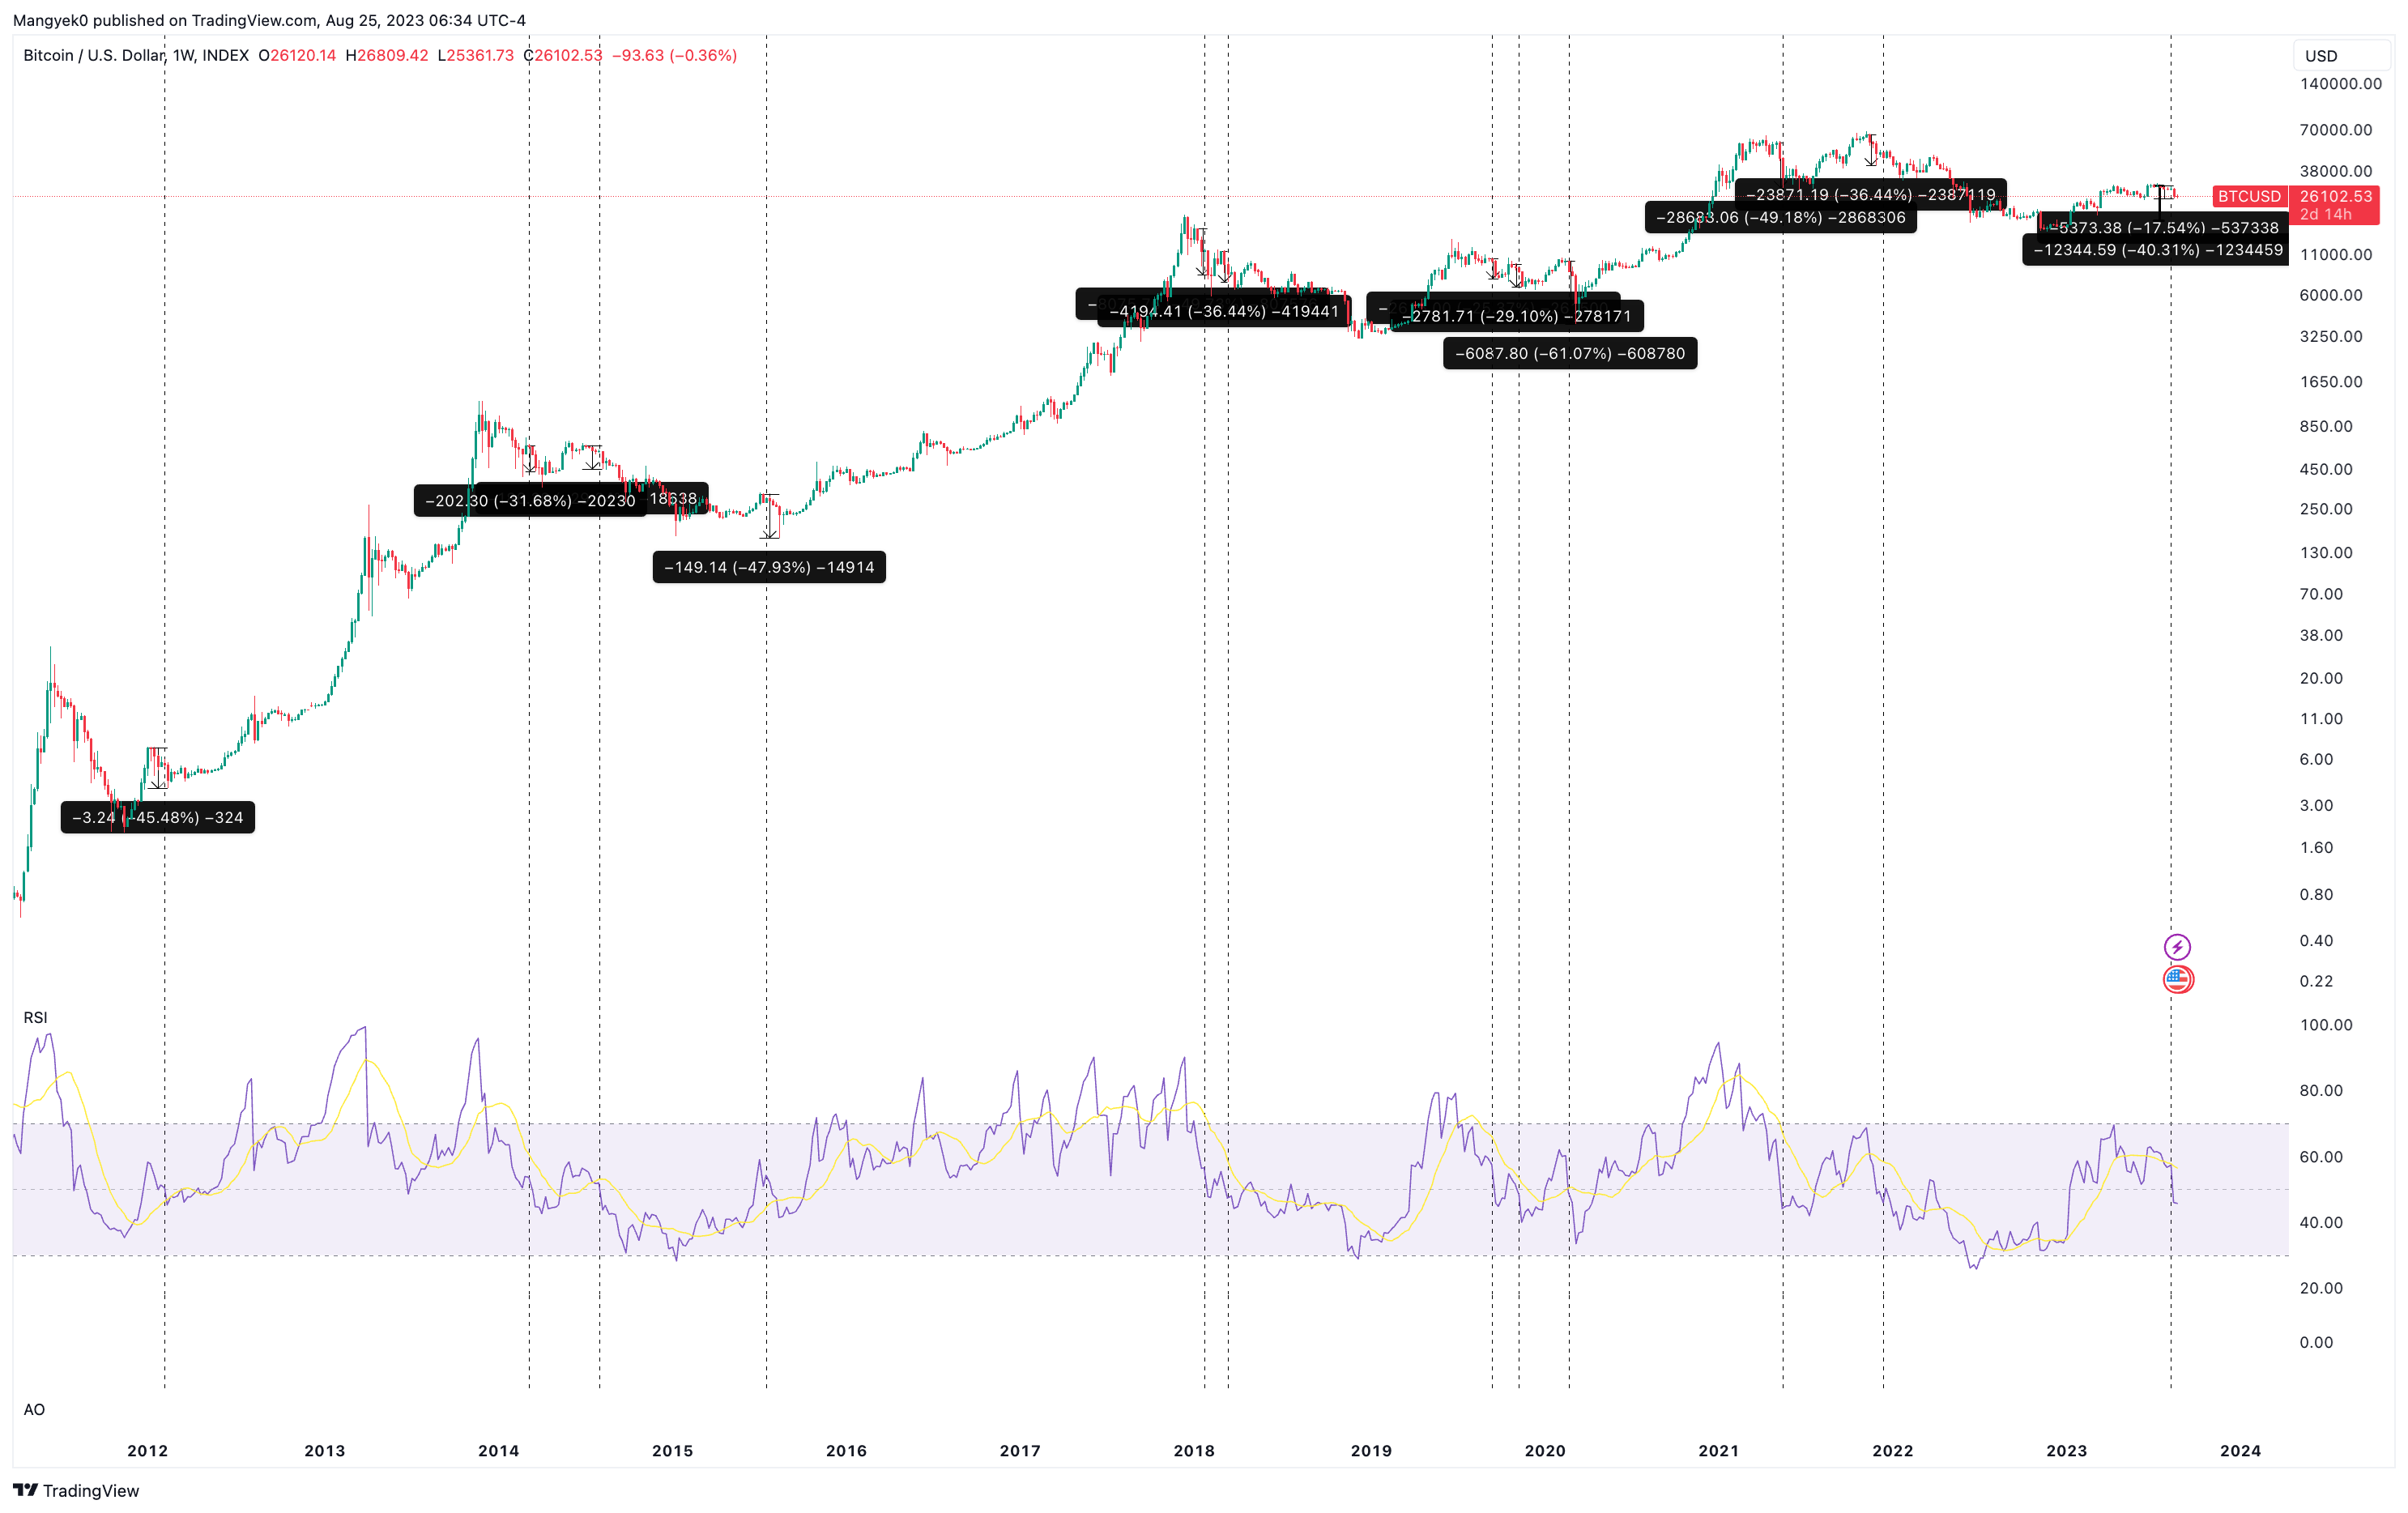
BTC/USDT 1-week chart
From a long-term perspective, this move would be perfect as it would rebalance the inefficiencies discussed in a previous publication.
More evidence of an impending crash for BTC holders
Historical returns for Bitcoin price from a quarterly time frame provide a more nuanced outlook. The attached chart shows that on average Q3 is the worst-performing quarter for BTC. The August 17 crash might be surprising for many investors, but history often rhymes. To add salt to the wound, September is the worst-performing month for BTC in its 12-year history, with an average return of -5%.
This data adds further proof to Bitcoin price and its bearish short-term future.
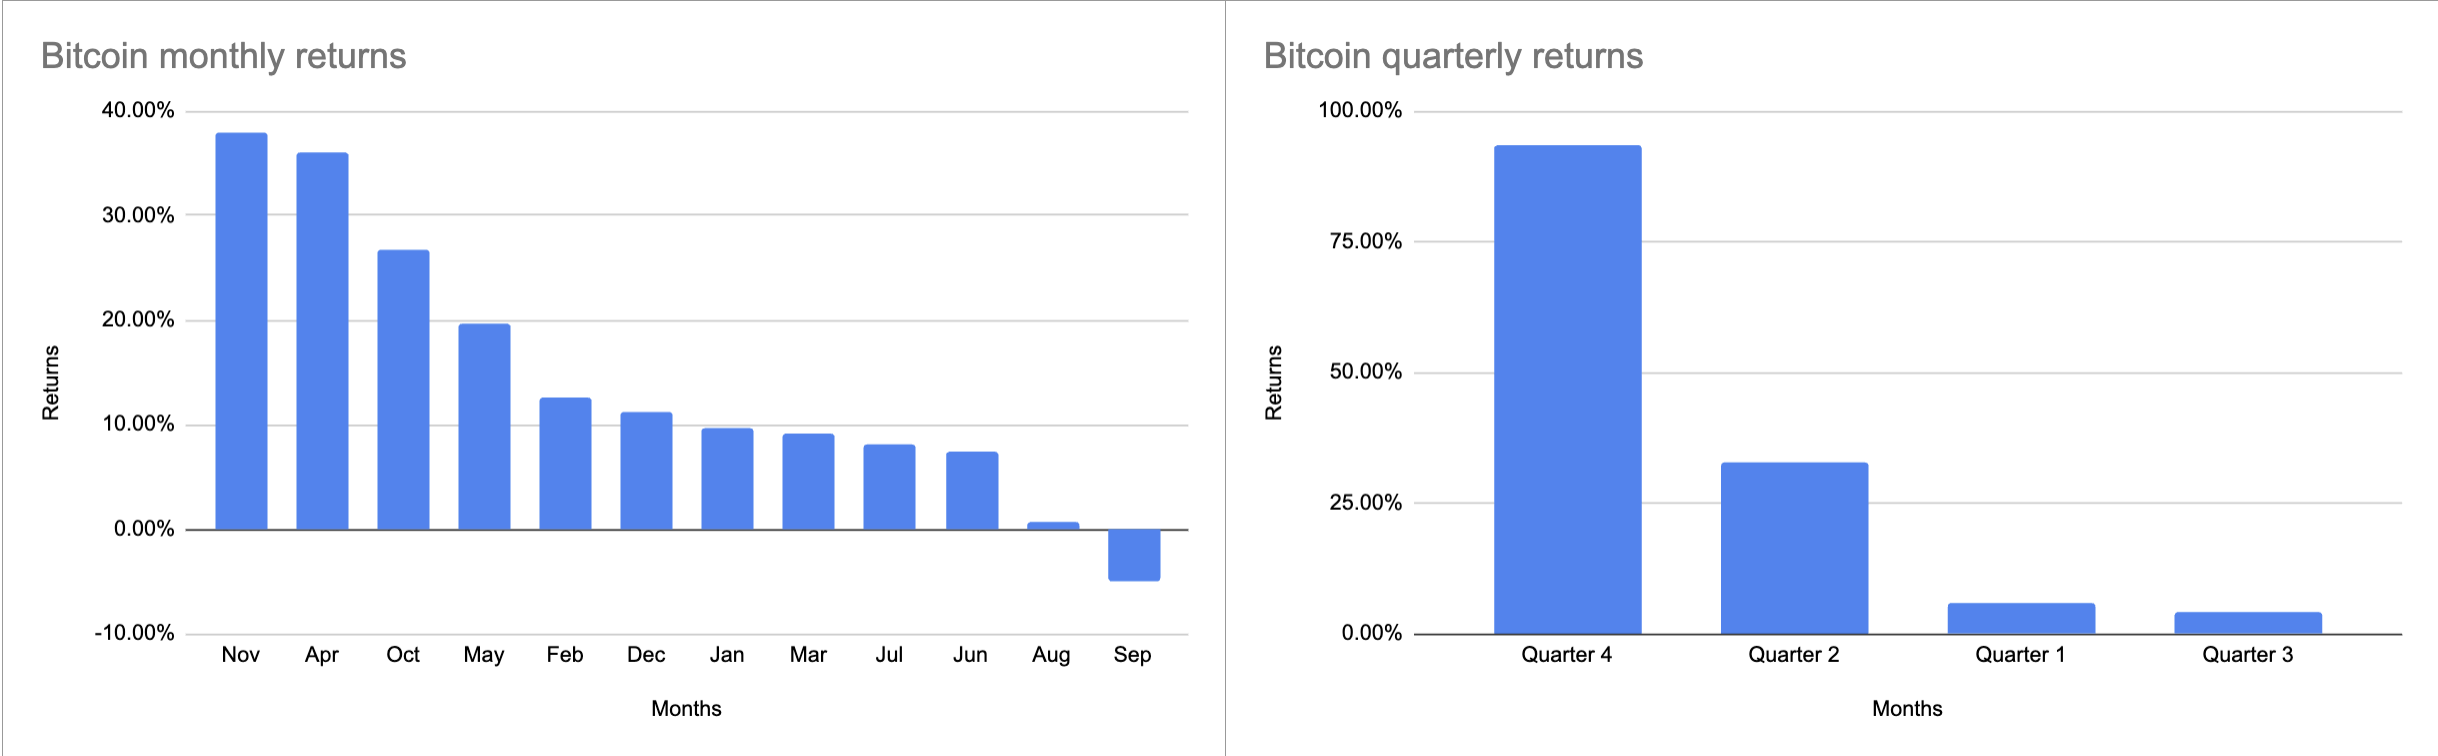
BTC monthly and quarterly returns
The 365-day Market Value to Realized Value (MVRV) for Bitcoin price hovers around 5.61%, suggesting that these long-term holders are still in profit. The 30-day MVRV reads -6.78% revealing that the August 17 crash has already caused these holders to capitulate their holdings.
Since this indicator measures the average profit and loss of investors that purchased BTC over a specific period, it can be used to identify buy and sell zones. Another way of looking at the current MVRV readings is that the short-term holders were already forced out of their holdings, but long-term holders are still safe. So, a further decline in Bitcoin price would naturally push these investors to capitulate as well.
Such a development falls perfectly in line with BTC’s historical data forecasts.
%20[16.56.02,%2025%20Aug,%202023]-638285684534524558.png)
BTC MVRV 30-day and 365-day
Jackson Hole and its impact on Bitcoin price
While technicals and on-chain data forecast a potential crash in Bitcoin price, investors need to also factor in the upcoming Jackson Hole Symposium, which is a major macroeconomic event.
The US Federal Reserve Chairman Jerome Powell’s speech will be the highlight of this event. Both the traditional and cryptocurrency markets will react in accordance with Powell’s speech. FXStreet senior analyst Yohay Elam sheds light on three possible scenarios.
Read more: Jackson Hole Preview: Powell poised to keep markets on edge, three scenarios for the US Dollar
- The Fed Chairman notes a data-dependent approach. This outlook would trigger a rally for the US Dollar while stocks and Gold would likely suffer, says FXStreet senior analyst Yohay Elam.
- Powell suggests a ‘higher for longer’ outlook: This would trigger a sell-off in stock and Gold while catalyzing an uptick for US Dollar.
- Fed Chair outlines a dovish outlook and celebrates the drop in inflation: Such a scenario would cause the US Dollar to plunge, but stocks and Gold would rally.
Bitcoin falls into a risk asset category along with stocks. Hence, the first scenario, which has the highest probability of occurrence, would not bode well for BTC bears. However, these macroeconomic events do not have a long-term impact on Bitcoin price, just a short-term spike in volatility.
Regardless, investors are advised to be cautious during this event.
Also read: Bearish crypto markets fear hawkish Powell at Jackson Hole: scenarios for Bitcoin
Like this article? Help us with some feedback by answering this survey:
Author

Akash Girimath
FXStreet
Akash Girimath is a Mechanical Engineer interested in the chaos of the financial markets. Trying to make sense of this convoluted yet fascinating space, he switched his engineering job to become a crypto reporter and analyst.


