Bitcoin Weekly Forecast: BTC downside likely after 20-week EMA culls bulls
- Bitcoin price continues to retrace its January 2022 steps, hinting at a steep correction on the big picture.
- A breakdown of the $25,229 support level will confirm and kickstart a bearish outlook for BTC.
- If bulls fail to reduce the bearish pressure, the pioneer crypto could revisit the $20,431 support level.
- A bullish scenario will develop if BTC flips the $30,000 psychological level into a support.

Bitcoin (BTC) bearish price fractal, as discussed in a previous article, is underway, but the lack of volatility is causing ambiguity and doubt. Regardless, BTC might see a bit of an upside before the long-term bearish scenario plays out.
Read more about Bitcoin’s bearish fractal: Bitcoin Weekly Forecast: BTC contemplates crash in September
Bitcoin price delays bearish outcome as volatility dries up
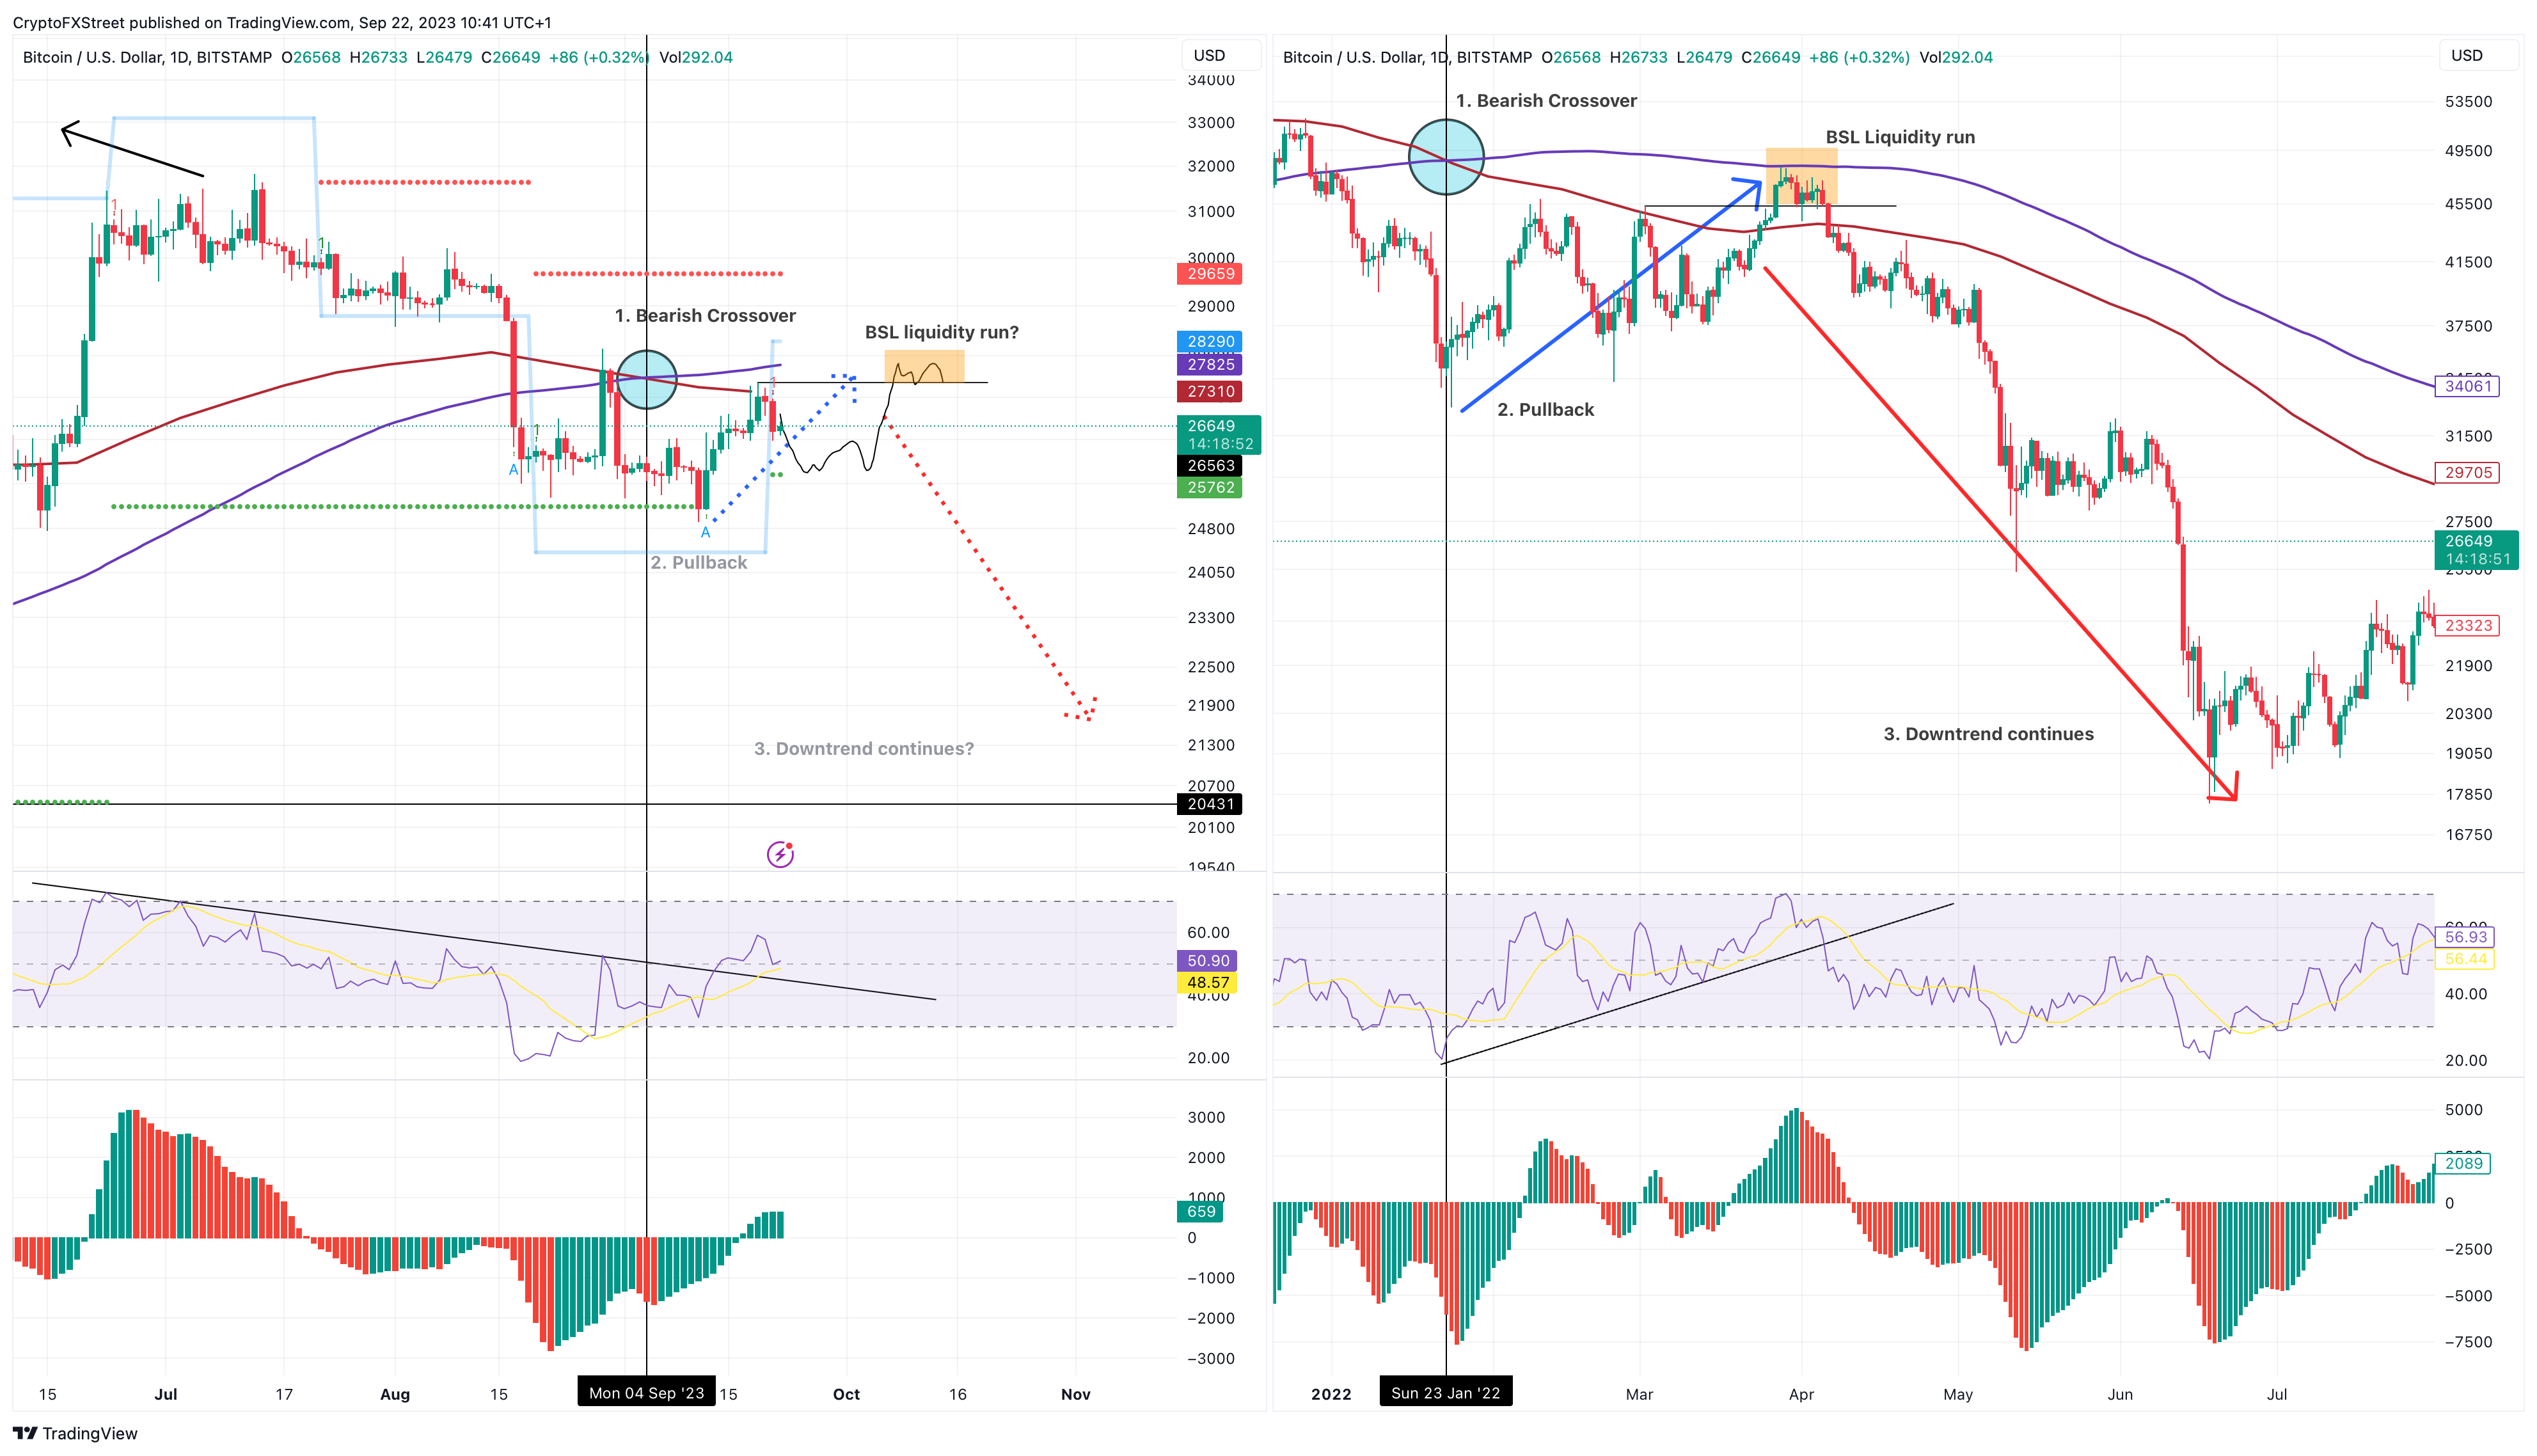
Bitcoin (BTC) price trades at $26,628 after dropping 3.13% over the last 48 hours after rejection at the 20-week Exponential Moving Average (EMA) of $27,290 on September 18. The lack of volatility is another reason for the bearish fractal not progressing.
Rejection at the 20-day EMA was also noted in March 2022, which was soon followed by a small correction and a sweep of the buy-side liquidity to the upside. If such a price action were to unfold again for Bitcoin, a revisit of the $25,762 could lead to a sweep of the $27,500 level and the buy side liquidity resting above it.
Read more: What volatility? Bitcoin price dismisses FOMC, Mt. Gox with $26.7K dip
BTC/USDT 1-day chart
Invalidation of this short-term bearish fractal will occur if Bitcoin price flips the $29,659 hurdle into a support level. In such a case, BTC could revisit the $31,643 resistance level.
Contemplating a bullish BTC outlook
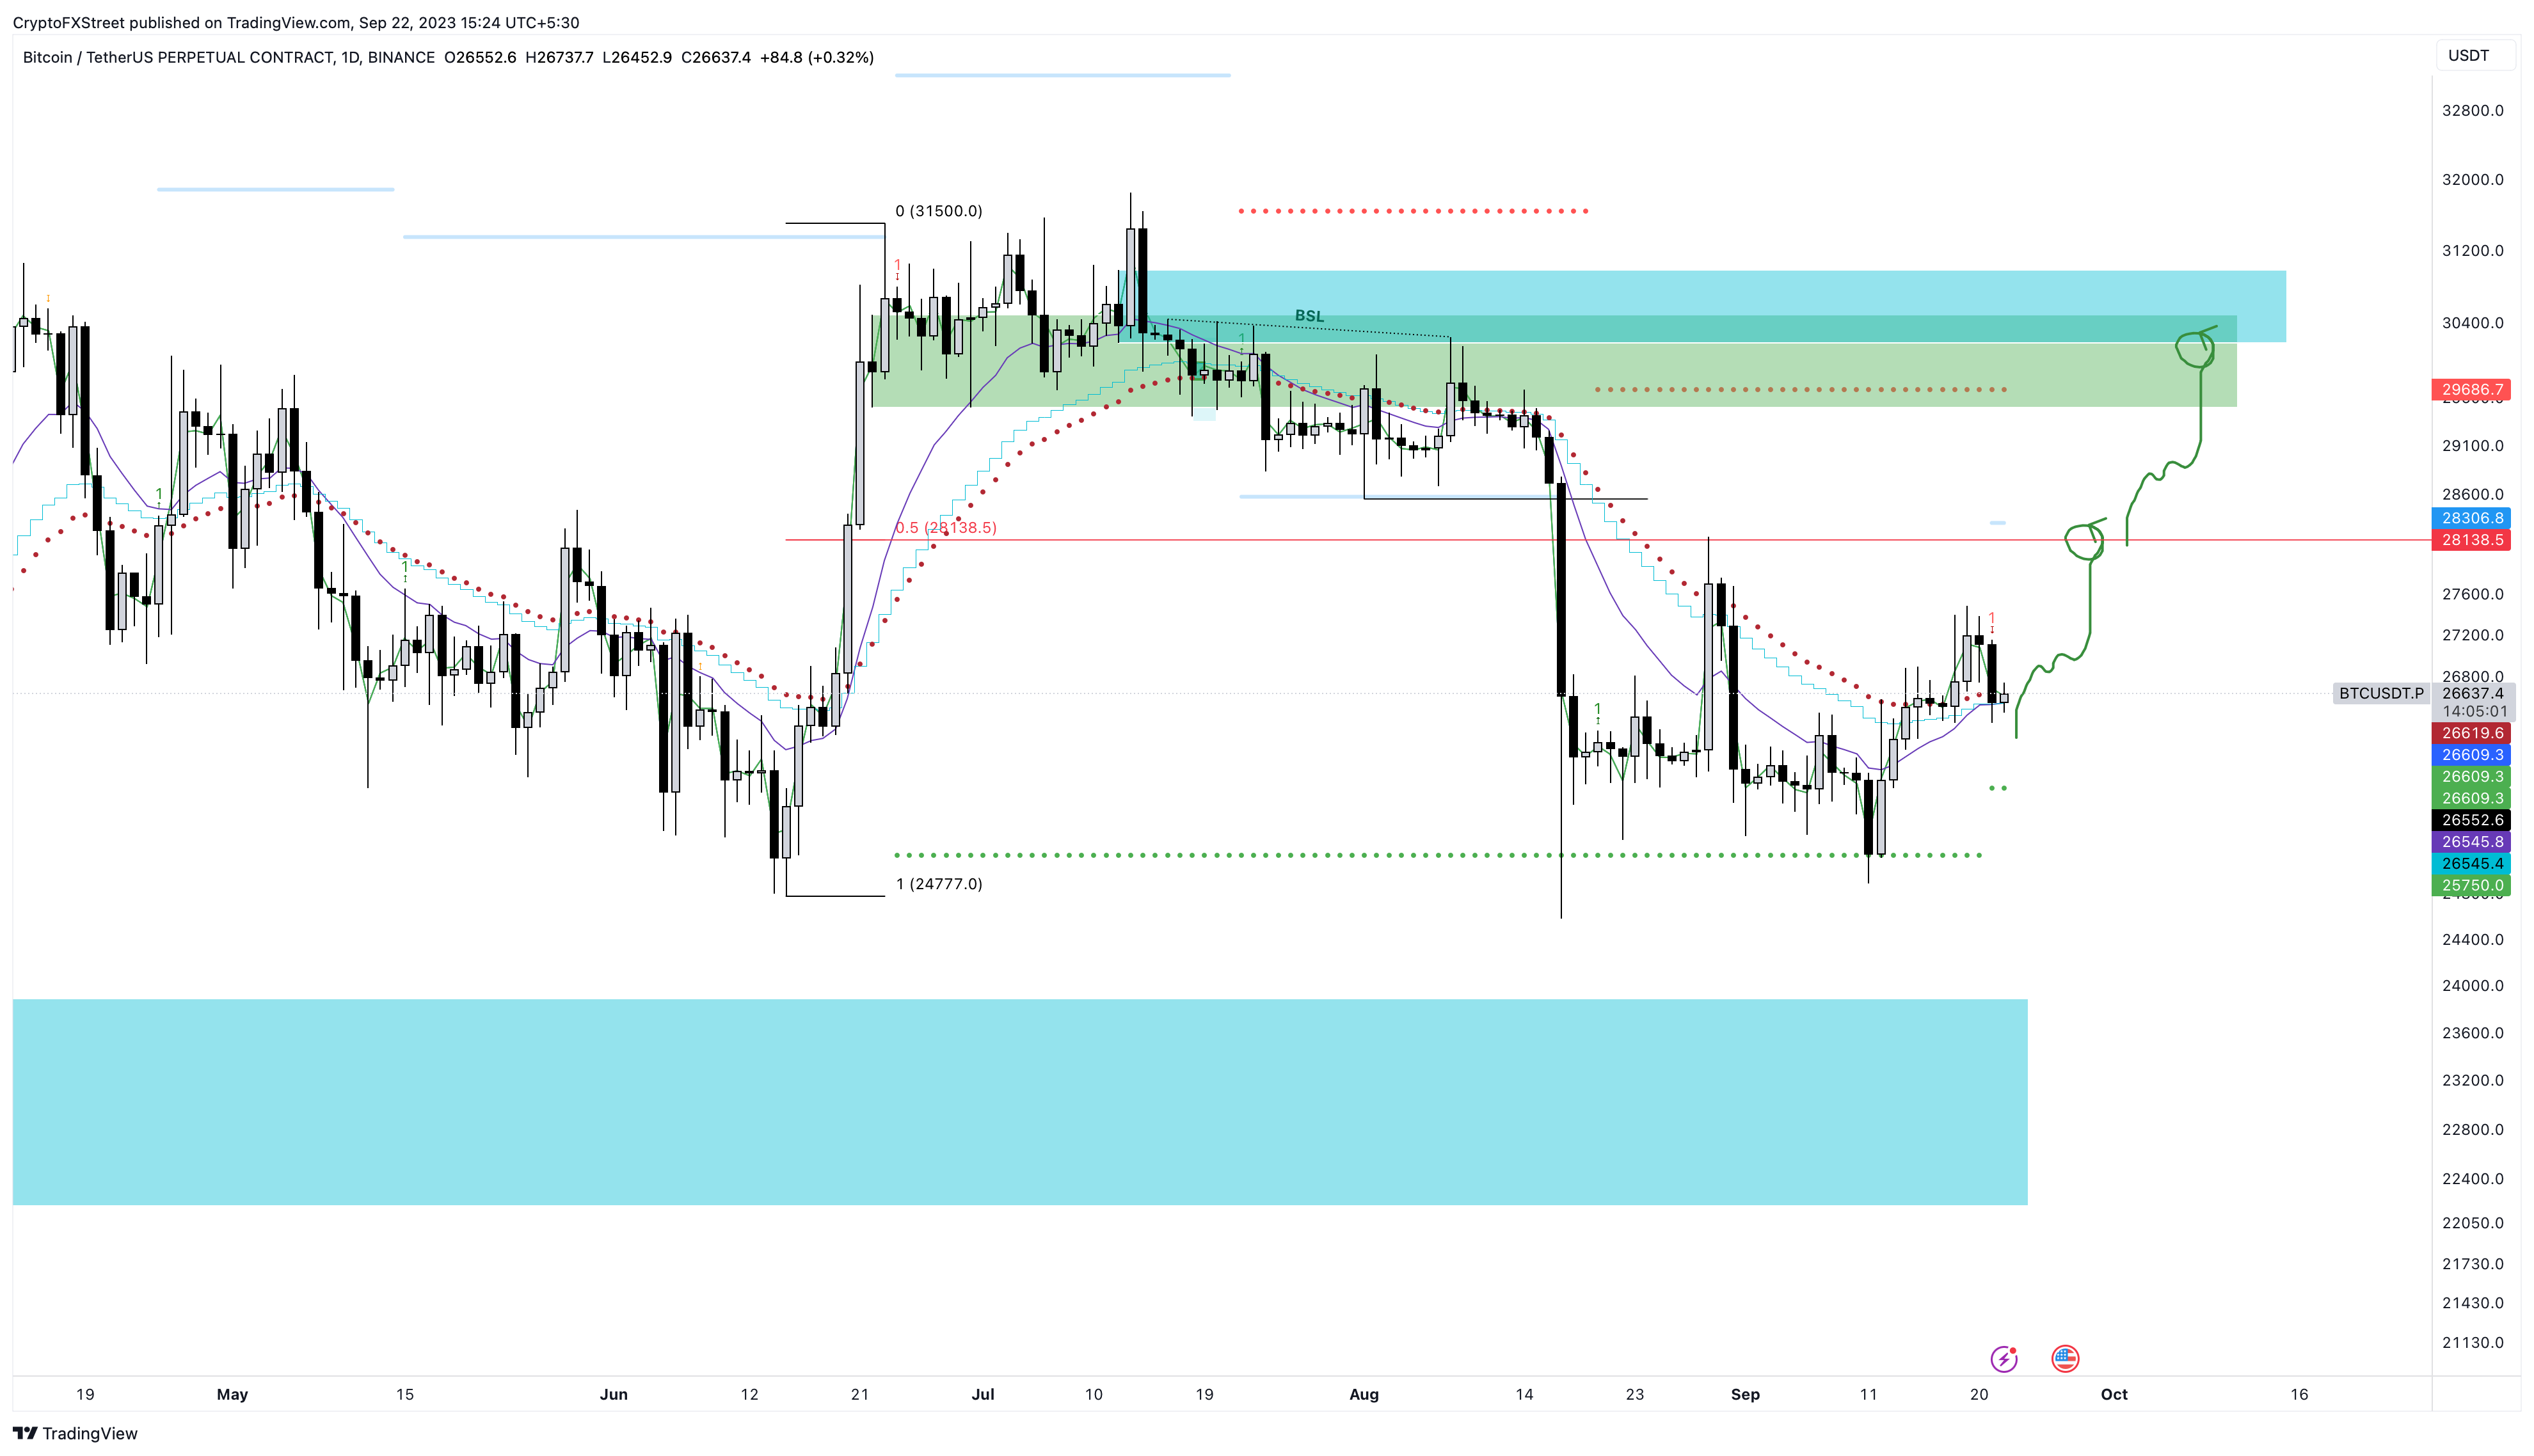
On the daily chart, away from the bearish fractal perspective, Bitcoin price looks bullish after it reclaimed key hurdles. These key resistance levels are the 13-day, 25-day, and 30-day EMAs, all of which are at a confluence at $26,580.
Unlike the long-term bearish outlook described above, which has a higher probability of playing out, the current bullish outlook has low probabilities. Moreover, a breakdown of the EMA confluence at $26,580 will invalidate it.
BTC/USDT 1-day chart
Conclusion
The long-term bearish fractal is still in play, and the targets for this outlook mentioned in the previous article are still valid.
But if investors are looking to open long positions with the EMA confluence as a support level, they should tread carefully. This bullish outlook is contingent that the $26,580 foothold will not give in to selling pressure on the daily timeframe.
On the other hand, a continuation of the downtrend over the weekend could fit into the short-term bearish perspective described at the start of this article. For this scenario, the take-profit levels include $25,757 and $25,153.
Also read: First Ethereum futures ETF expecting approval by October 2
Author

Akash Girimath
FXStreet
Akash Girimath is a Mechanical Engineer interested in the chaos of the financial markets. Trying to make sense of this convoluted yet fascinating space, he switched his engineering job to become a crypto reporter and analyst.


