Bitcoin Weekly Forecast: BTC contemplates crash in September
- Bitcoin price continues to move sideways with no directional bias in sight.
- While the weekly chart suggests a short-term pullback potential, BTC fractal hints at a steep correction.
- Invalidation of the bearish outlook will occur if the 200-day SMA at $27,670 is flipped into a support level.

Bitcoin price remains unfazed by the US CPI announcement on September 13 and continues to move in a range. The weekly chart, however, shows a potential short-term recovery rally that could set the stage for a steep correction.
Also read: Bitcoin Weekly Forecast: BTC could revisit $21,000 as sell signals multiply ahead of US CPI
Bitcoin price fractal hints at what comes next
Bitcoin price action holds the potential for history to repeat or at least rhyme. On the daily chart, BTC currently trades at $26,257 and is supported by the Momentum Reversal Indicator’s (MRI) support level depicted in green dots at $25,188.
Another key observation is the bearish crossover between the 200-day Simple Moving Average (SMA) and the 20-week Exponential Moving Average (EMA). The last time such a similar crossover occurred was on January 23, 2022, after which Bitcoin price triggered a pullback that retested the 200-day SMA. Rejection at this level was followed by a continuation of the downtrend, where Bitcoin price shed 70% and formed a cycle bottom.
If these patterns were to repeat, a pullback would put Bitcoin price at $27,670. A continuation of the downtrend will encounter two key support levels - $25,186 followed by $20,431.
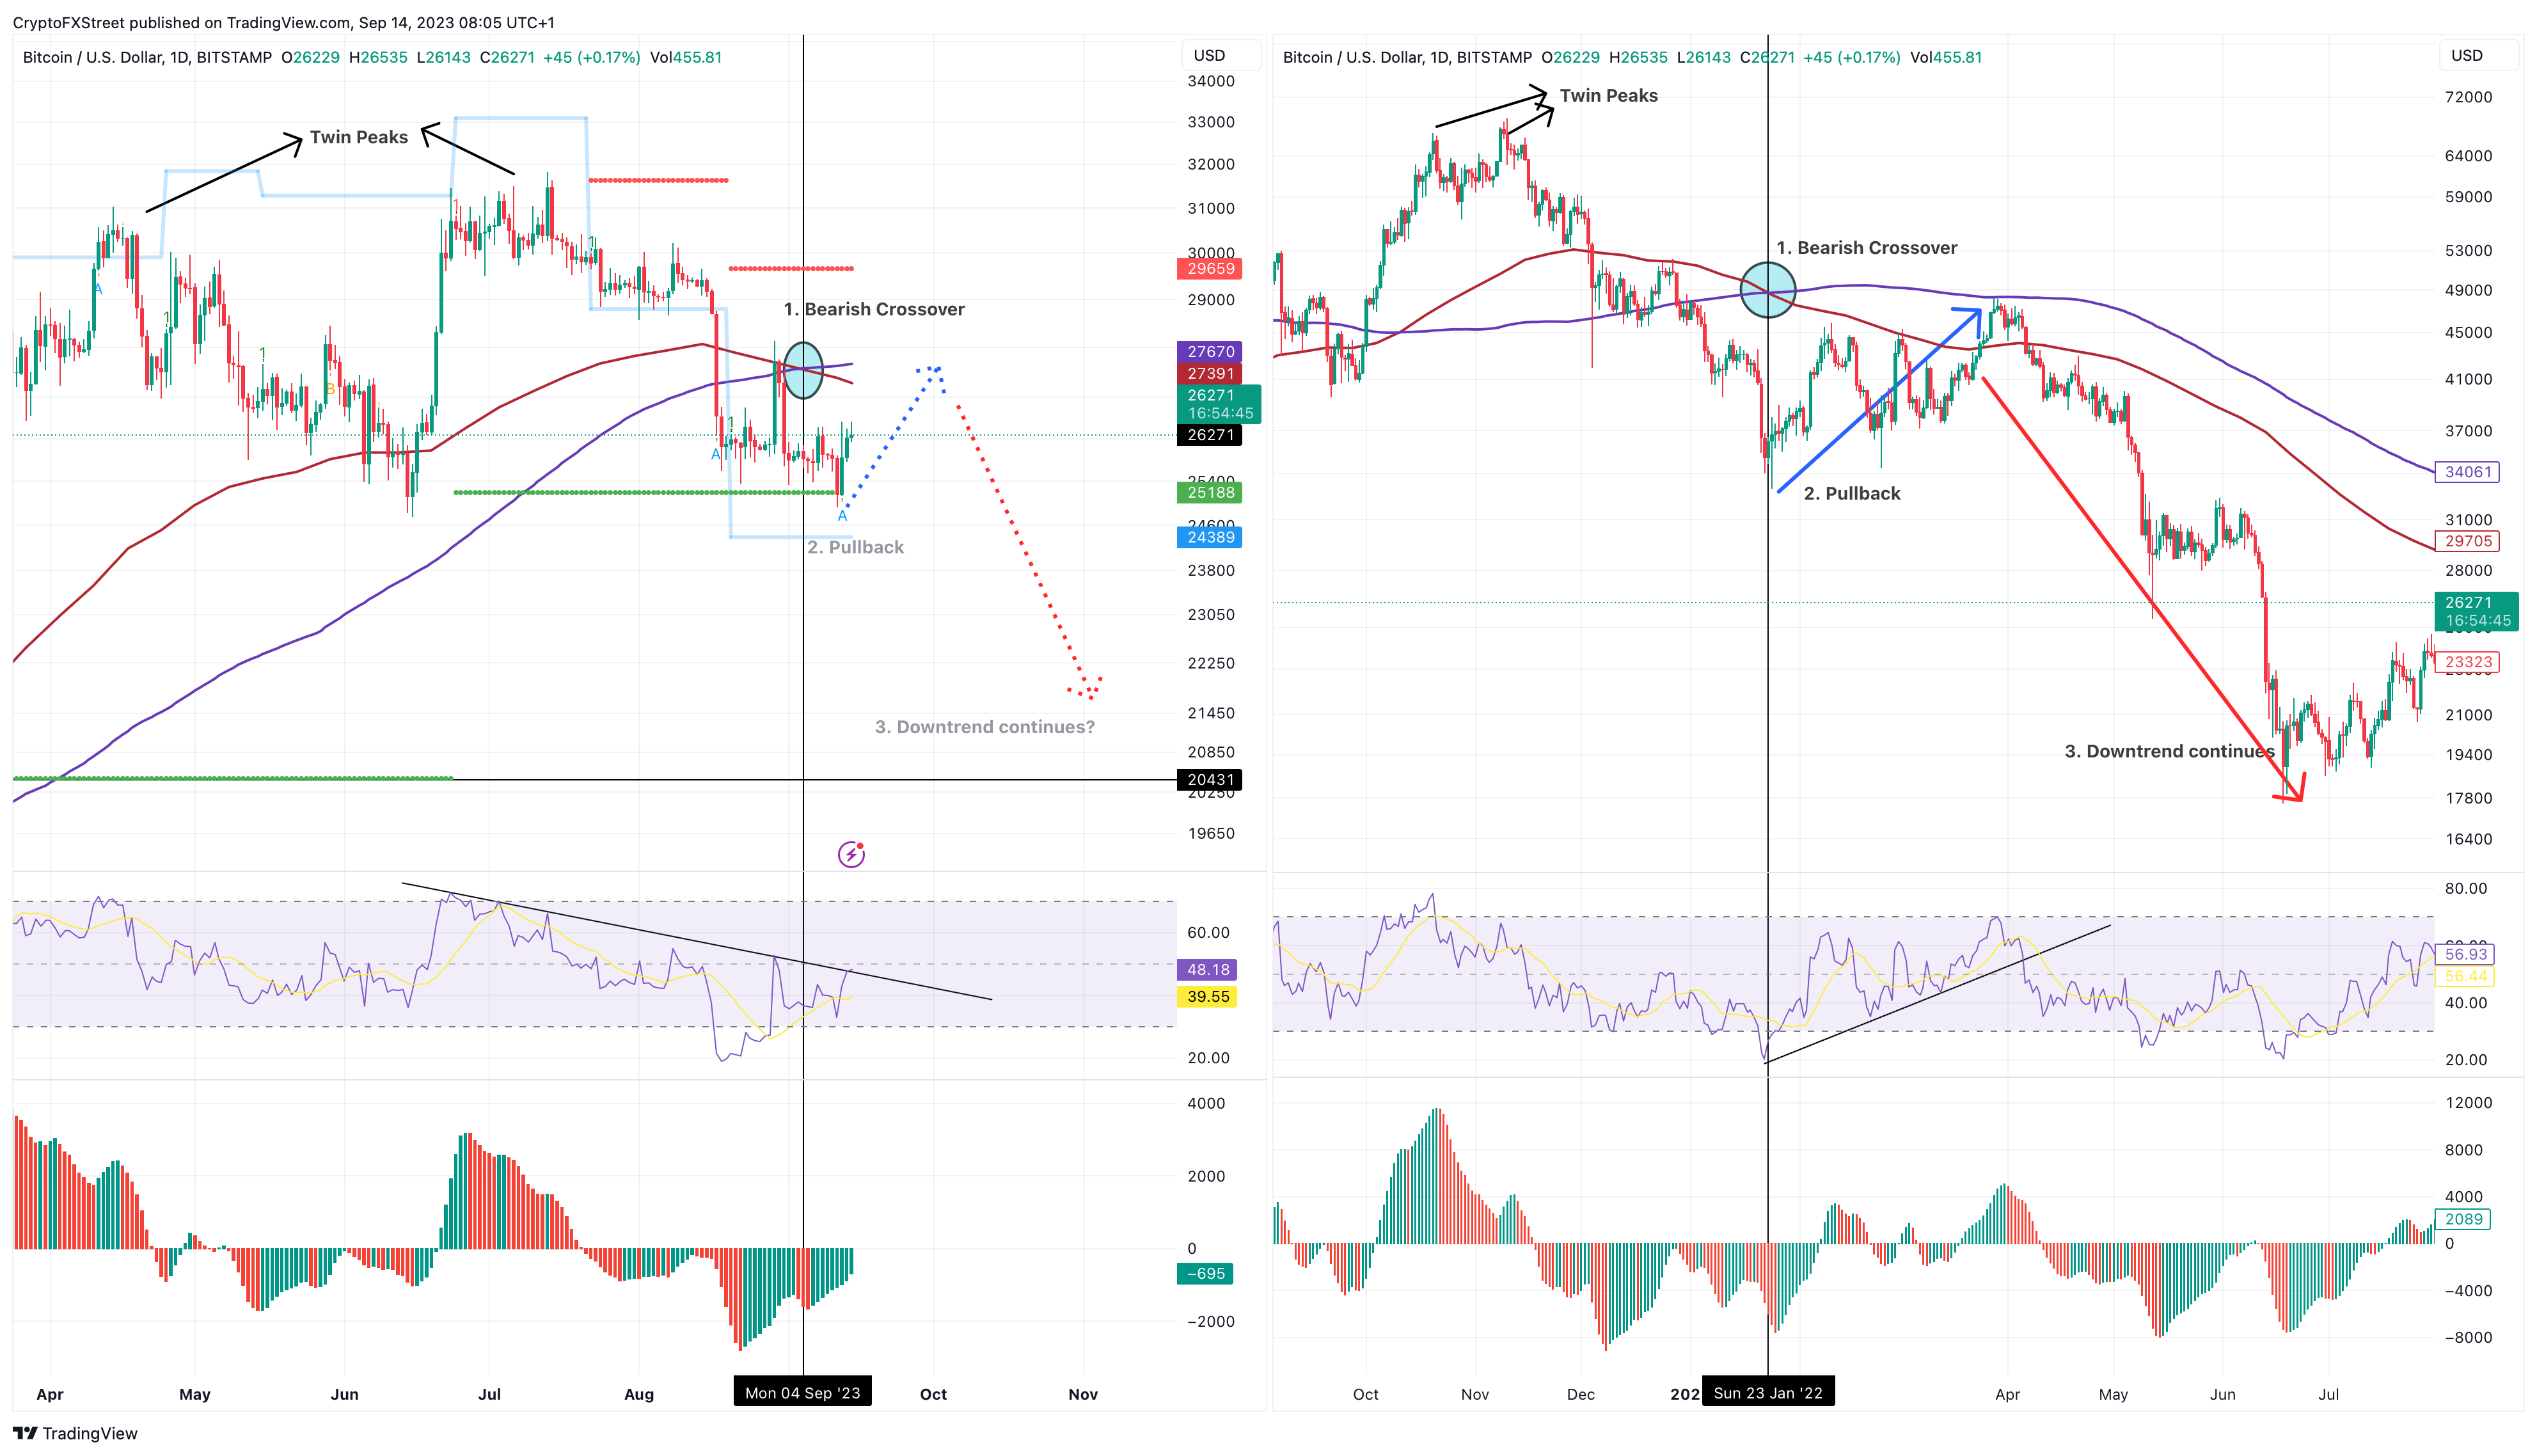
BTC/USDT 1-day chart
Other bearish BTC cues
As mentioned in the previous publication, Bitcoin price on the weekly chart has produced a lower low, signaling a breakdown of the 2023 rally. A further descent would not be out of the question, and investors should be surprised if BTC does not plummet.
The Relative Strength Index (RSI) on the weekly time frame has also slipped below the mean level of 50. Until Bitcoin price pushes higher enough for RSI to recover above the mean level, the weekly timeframe for BTC remains bearish.
There is, however, an off chance that Bitcoin price disregards the bearish outlook and rallies, due to the MRI’s green “one” buy signal. In such a case, BTC could trigger a minor recovery rally until it retests the hurdle at $27,670.
As discussed above, if history repeats, rejection at the said level could re-engage the high timeframe bearish outlook.
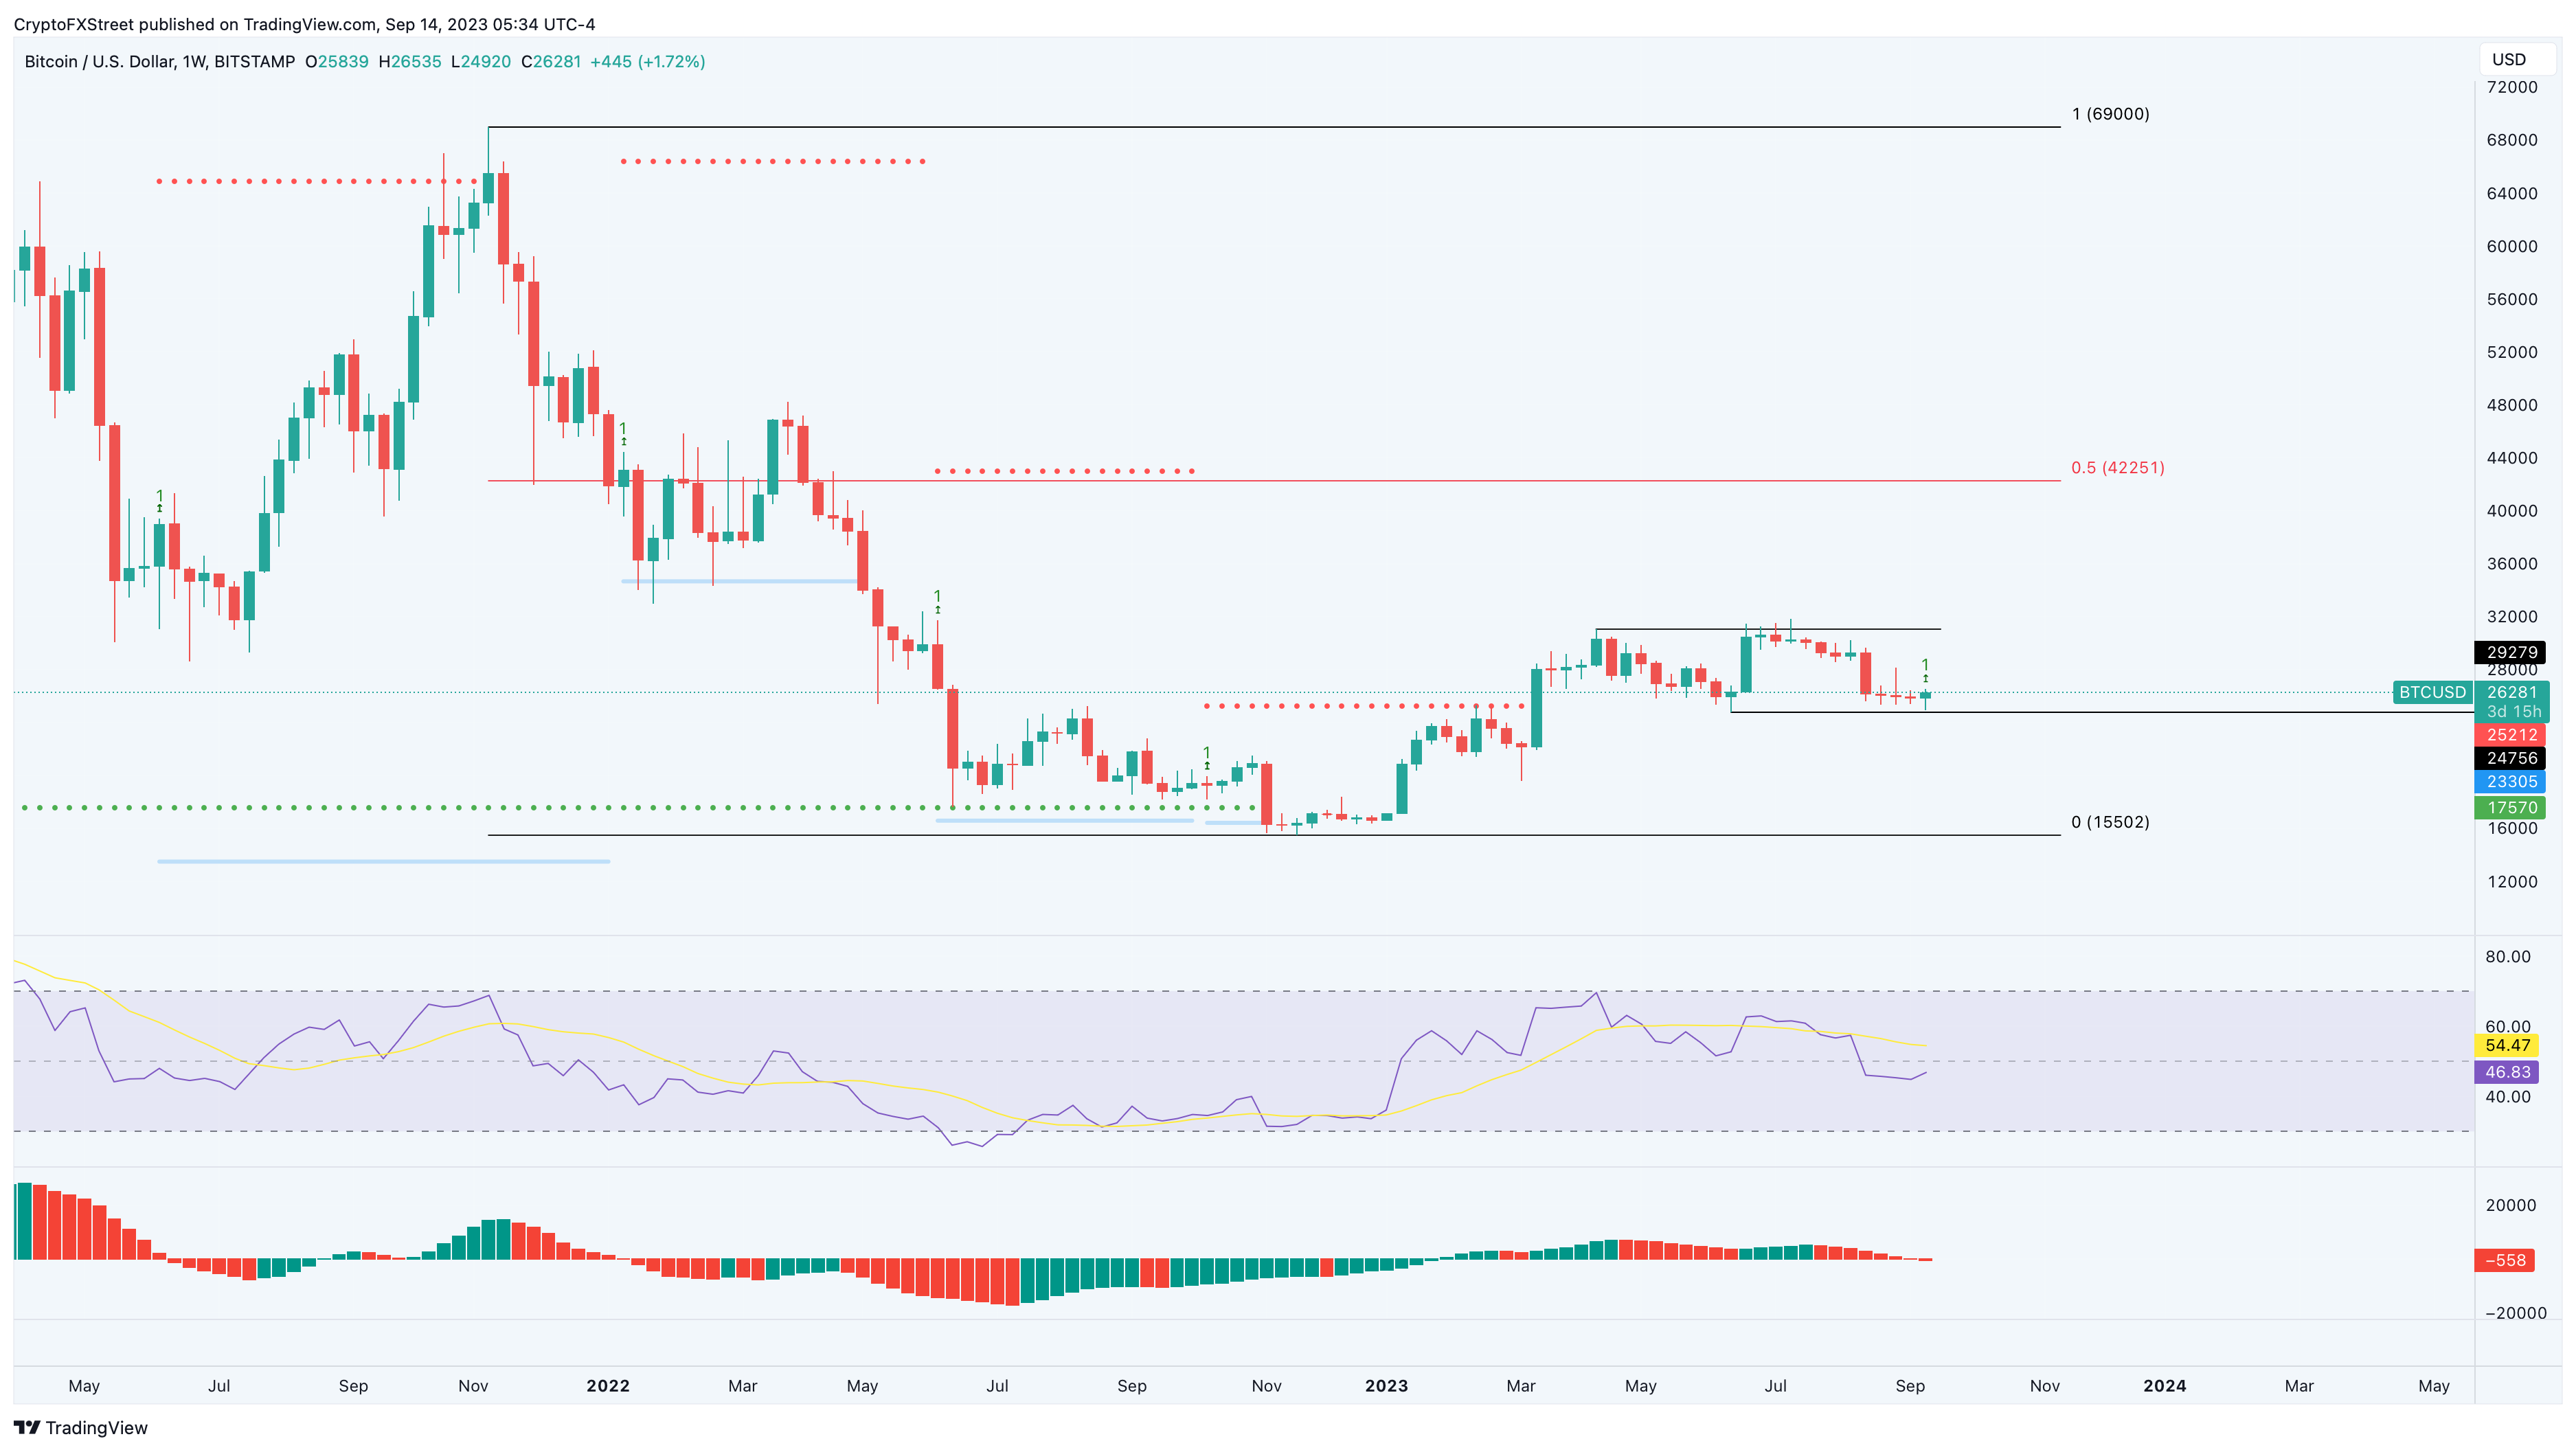
BTC/USDT 1-week chart
Lastly, we have the historical returns data for Bitcoin, which shows that September is the worst-performing month in its 12-year history. As seen in the image, the best-performing month is November, with an average return of 37.96%, and September ranks the lowest with a -5% return.
The same idea extends to quarterly returns, making Q3 the worst-performing quarter with an average return of 4.21% and Q4 with an average return of 93.38%.
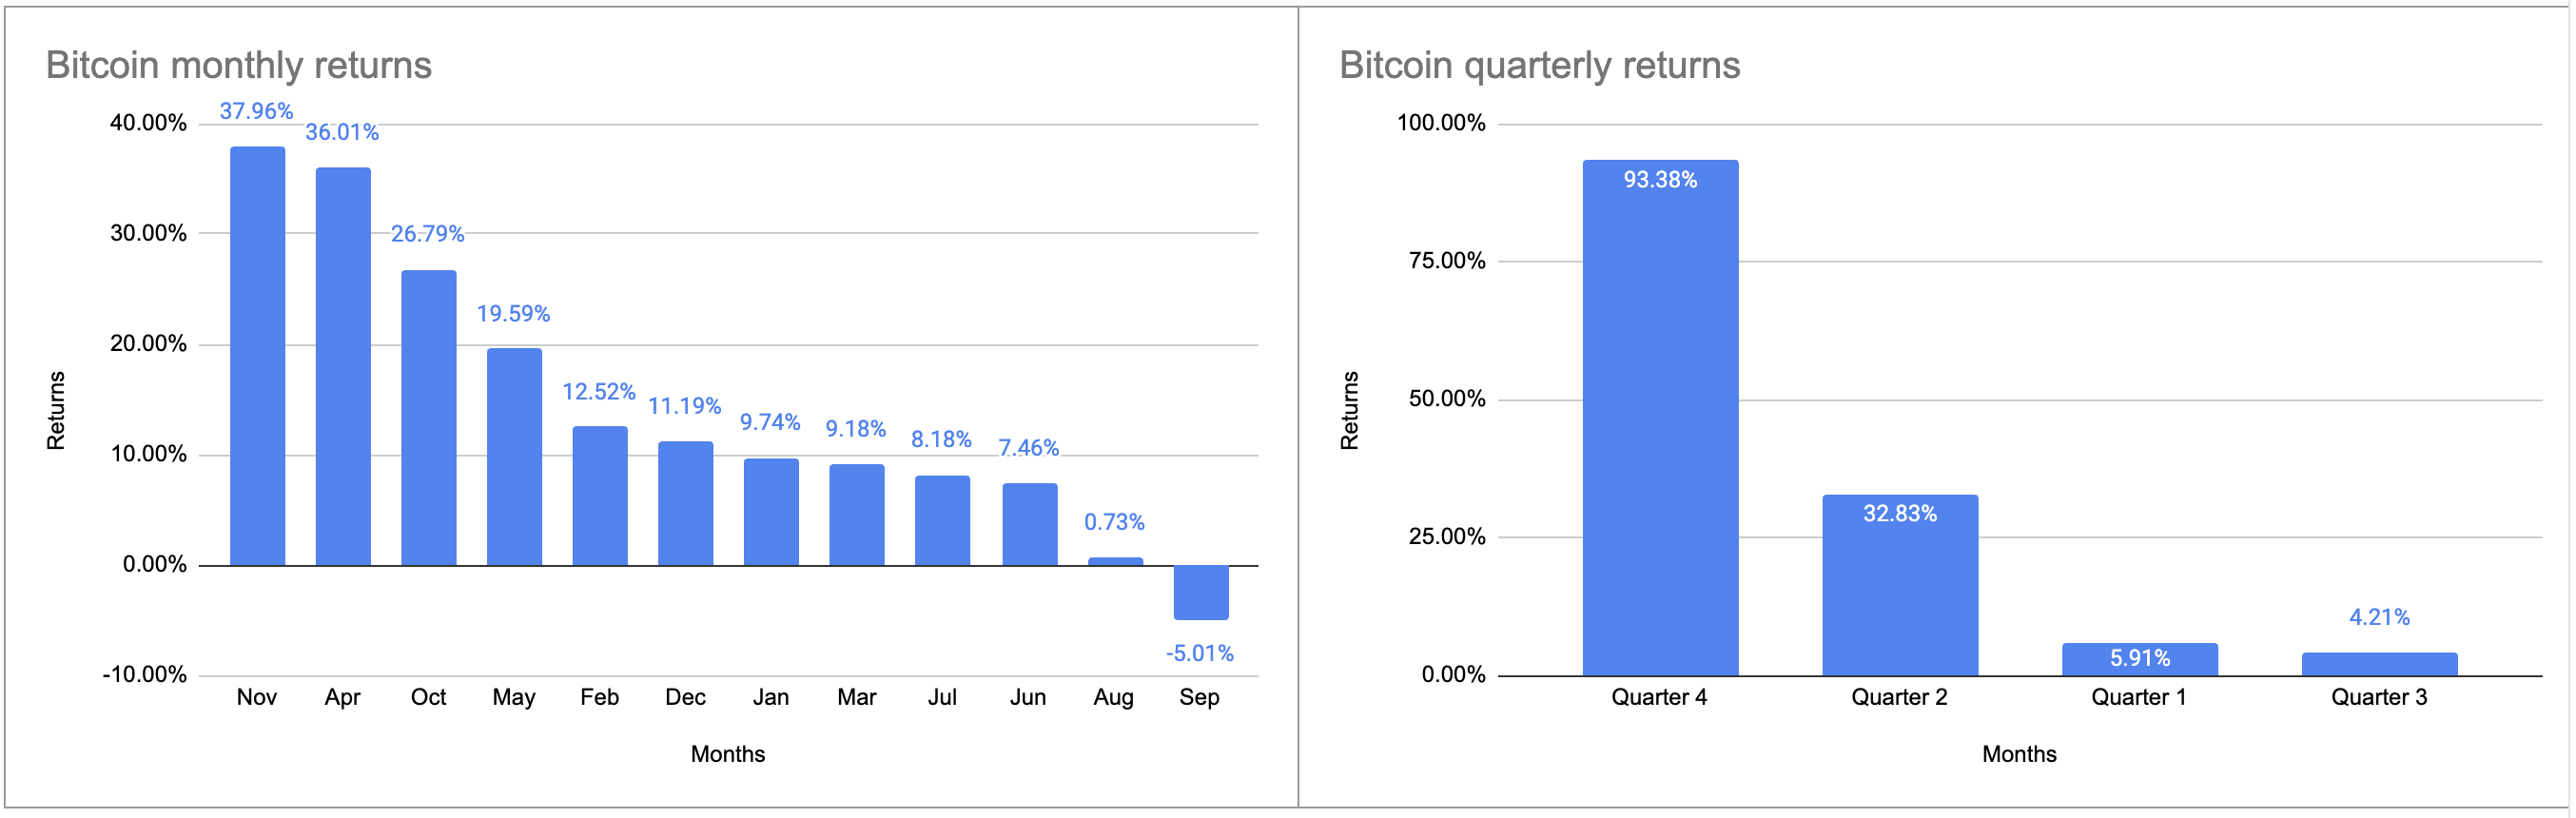
BTC monthly, quarterly returns
Bitcoin bulls and their comeback plans
Invalidation of the bearish outlook will occur if Bitcoin price flips the 200-day SMA at $27,670 on the weekly timeframe into a support floor. If BTC bulls manage to stay above the newly formed support, chances are it will attract sidelined buyers. Such a development could propel BTC to key resistance levels at $30,000 and $36,000.
Another scenario where Bitcoin price could blast through these hurdles would be if a spot Bitcoin Exchange-Traded Fund (ETF) is approved. The sudden frenzy in buying pressure after an ETF is approved would overpower the selling pressure and potentially propel BTC beyond $36,000 to tag the $40,000 psychological level.
NEXT DATES TO WATCH:
— James Seyffart (@JSeyff) August 31, 2023
Middle of October are the next major days to watch. Namely October 16th. (& @GlobalXETFs' Oct 7)
Also, reminder that we fully expected delays on this round of spot #Bitcoin ETF filings. Would have been a shock if they were approved this week. pic.twitter.com/i14fg8FWun
Here’s the ETF timeline due for approval in the upcoming weeks.
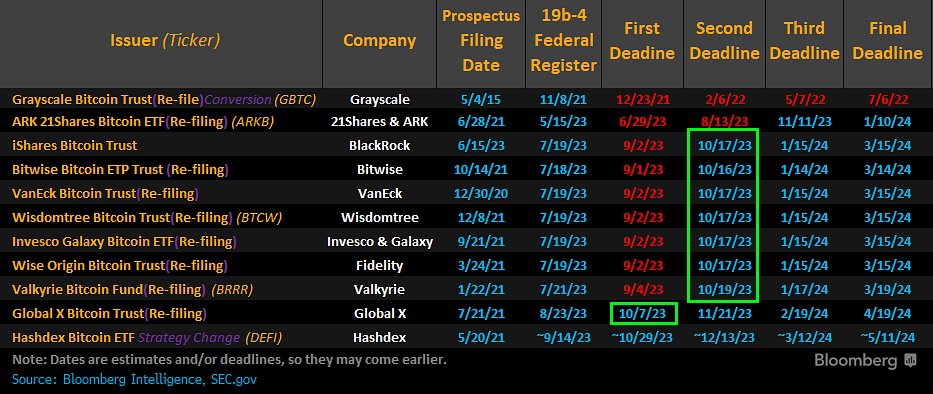
BTC ETF timeline
Like this article? Help us with some feedback by answering this survey:
Author

Akash Girimath
FXStreet
Akash Girimath is a Mechanical Engineer interested in the chaos of the financial markets. Trying to make sense of this convoluted yet fascinating space, he switched his engineering job to become a crypto reporter and analyst.


