Bitcoin Weekly Forecast: Bears take control after MicroStrategy’s margin call woes
- Bitcoin price hovers around the $34,752 support level, a breakdown of which could trigger a crash to $30,000.
- On-chain metrics and technicals are finally considering the possibility of a capitulation move to $30,000 or lower.
- A weekly candlestick close above $52,000 will invalidate the bearish thesis.

Bitcoin price suffered a massive setback after a minor uptrend due to the FOMC meeting on May 5. While the Fed concluded a 50 basis point hike in interest rates, the volatility that it brought caused the stock market and BTC to crash.
The Nasdaq 100 witnessed the biggest intraday slide since September 2020 and the king crypto crashed 10% and set a lower low. This crash comes after Crypto Twitter was filled with discussions of liquidation calls on MicroStrategy’s Bitcoin investment.
As of writing, the average price of the company’s 129,218 BTC purchases sits at roughly $30,200.
Crypto Twitter was addressing what would happen to MicroStrategy’s $205 million loan to purchase BTC in the case of a massive crash. The company’s CFO, Phong Le stated that $21,500 per Bitcoin would be a level where MicroStrategy would have to add more collateral to prevent a margin call.
But he also added that,
We have quite a bit of uncollateralized Bitcoin… that we could contribute in the case that we have a lot of downward volatility. So I think we're in a pretty comfortable place where we are right now.
Bitcoin price and bears’ control over it
Bitcoin price has breached out of an ascending parallel channel after traversing inside it for more than three months. This setup is obtained by connecting the three higher lows and two higher highs formed since January 24 using trend lines. Unlike the last two retests, the third retest slowly dismantled the 200 three-day Simple Moving Average (SMA), indicating that the buyers are losing control.
After a brief struggle at the channel’s lower trend line, BTC finally shattered below it and is currently hovering around $36,431. Interestingly, Bitcoin price currently hovers around the most significant level at $34,752. A bounce off this barrier could be the key to a minor uptrend that could eventually evolve into an uptrend.
However, things are looking a little weak for bulls and a weekly candlestick close below the $34,752 barrier will invalidate the optimism and trigger a crash to the $30,000 psychological level.
The last few times Bitcoin price slipped below this barrier, it recovered quickly and closed above it. Hence, a breakdown could snowball the selling pressure, leading to a capitulation.
The primary reason for pushing BTC down below would be to collect the liquidity resting below the $30,000 psychological level. This sweep would collect the sell-stops and is likely where a bottom will form for Bitcoin price.
While a downswing is not set in stone, investors need to tread lightly and stay away from leverage trading, at least until the directional bias is established or a stable base is formed.
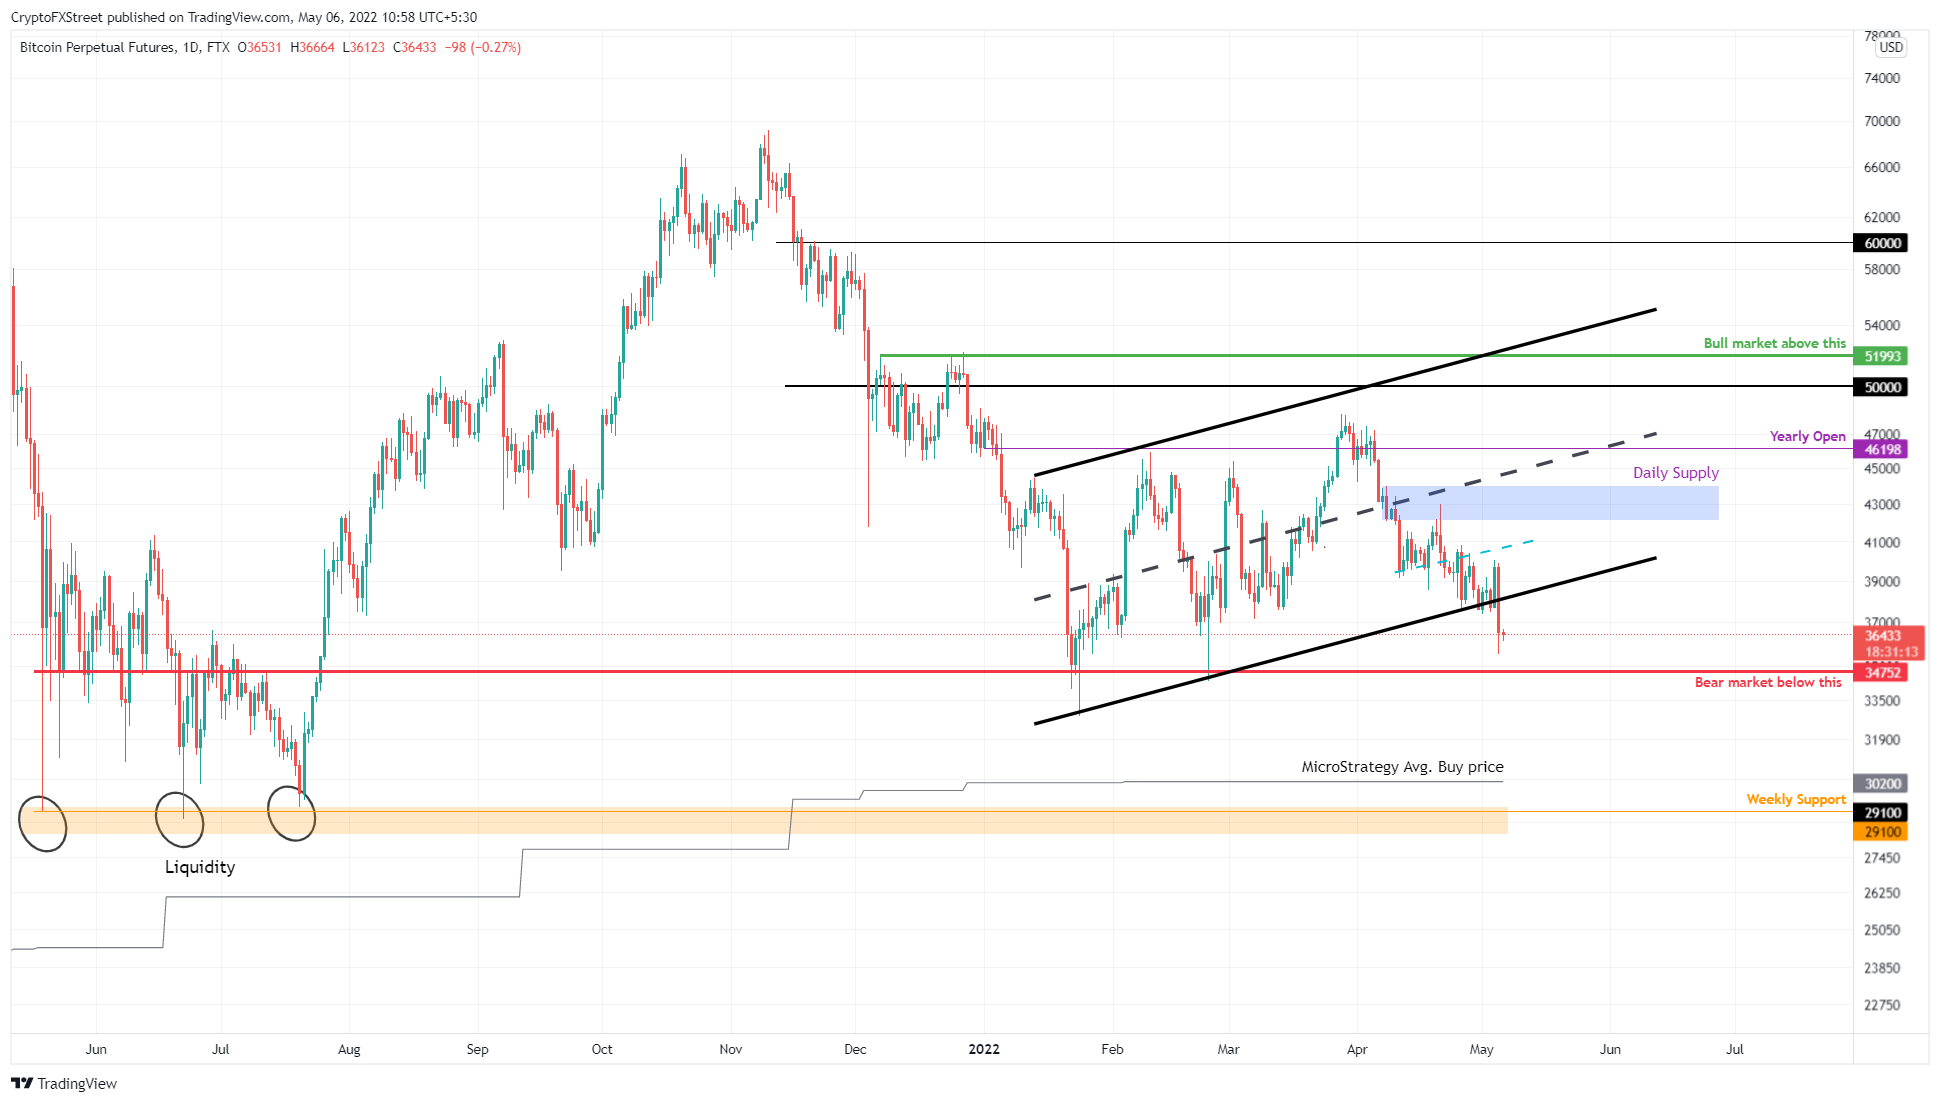
BTC/USDT 3-day chart
Another important on-chain metric that signals and supports this bearish outlook for Bitcoin price is the trend in Long-Term Holder (LTH) sentiment. The LTH Spent Price (pink) shows that the average purchase price of coins being spent by these investors is at break-even since it is meeting with the spot price. This development indicates that LTHs that accumulated BTC in 2021 and 2022 are panic selling at break-even on average.
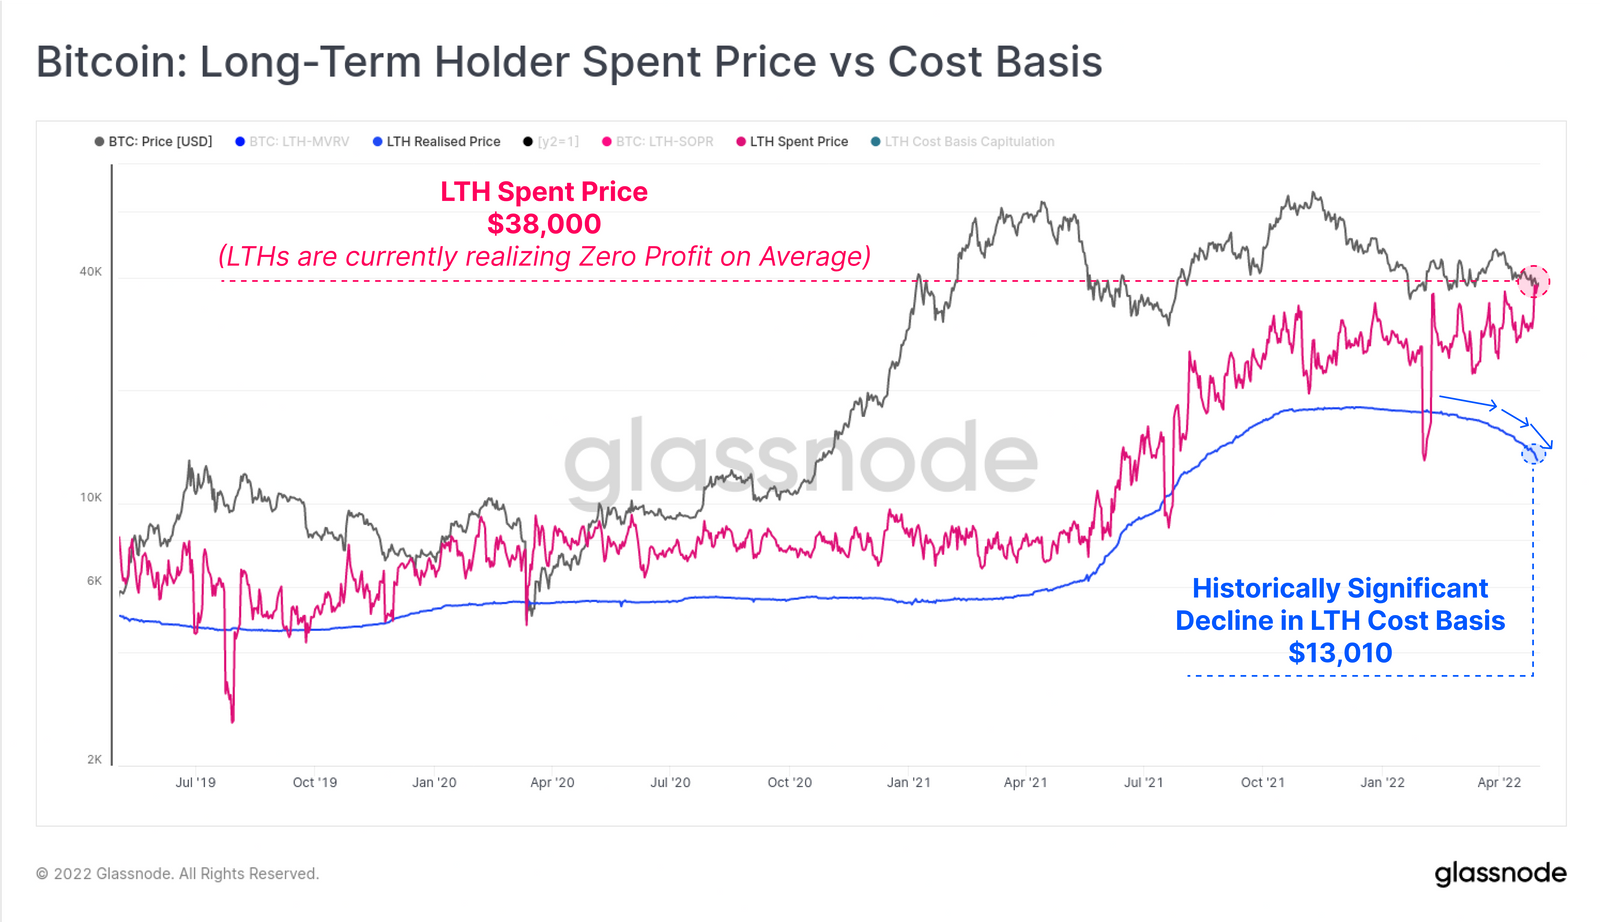
BTC long-term holder spent price vs. cost basis
Further questioning the validity of an upswing and adding credence to the bearish outlook is the recent retest of the 2-year Moving Average. In its eleven-year history, Bitcoin price has dropped below this barrier once every cycle or before the start of a massive bull run.
Investors can think of this move as a capitulation or a cataclysmic even that purges the sell-stop liquidity before triggering a multi-year bull run.
BTC 2-year MA multiplier
The only way bulls can make a comeback in this massive bearish outlook is by propelling Bitcoin price to slice through the intermediate resistance barriers and produce a weekly candlestick close above $52,000.
This move would produce a higher high relative to the ones formed in late December 2021 and invalidate the bearishness. In such a case, BTC is likely to produce a higher low around the $45,000 barrier and skyrocket to revisit the all-time high at $69,000 or even a new one at $100,000.
Author

Akash Girimath
FXStreet
Akash Girimath is a Mechanical Engineer interested in the chaos of the financial markets. Trying to make sense of this convoluted yet fascinating space, he switched his engineering job to become a crypto reporter and analyst.


