Bitcoin Price Prediction: BTC looks toward $60,000 while building upon strong on-chain metrics
- Bitcoin has broken above an ascending triangle pattern, targeting news all-time highs.
- The uptrend seems to have been validated by the MACD cross on the 4-hour chart.
- The drop in exchange balances remains persistent, suggesting that investors are holding long-term.
- A correction may take place if Bitcoin fails to secure higher support above $54,000.

Bitcoin has in the past few days consolidated above $50,000, suggesting that it is enjoying stability in the market. Meanwhile, price action has not been progressive above $54,000, which continues to delay the uptrend to new all-time highs above $60,000. However, a strong on-chain front reveals that the flagship cryptocurrency is on the way to achieving the target above the coveted $60,000 level.
Bitcoin’s recovery stems from key on-chain support levels
Glassnode’s UTXO Realized Price Distribution model illustrates robust on-chain support at $47,173. The green region represents a support block. Note that this vital support has not been this powerful since BTC exchanged hands at $11,000. Moreover, the range between $45,000 and $48,900 has transformed into the largest on-chain accumulation level in BTC’s history.
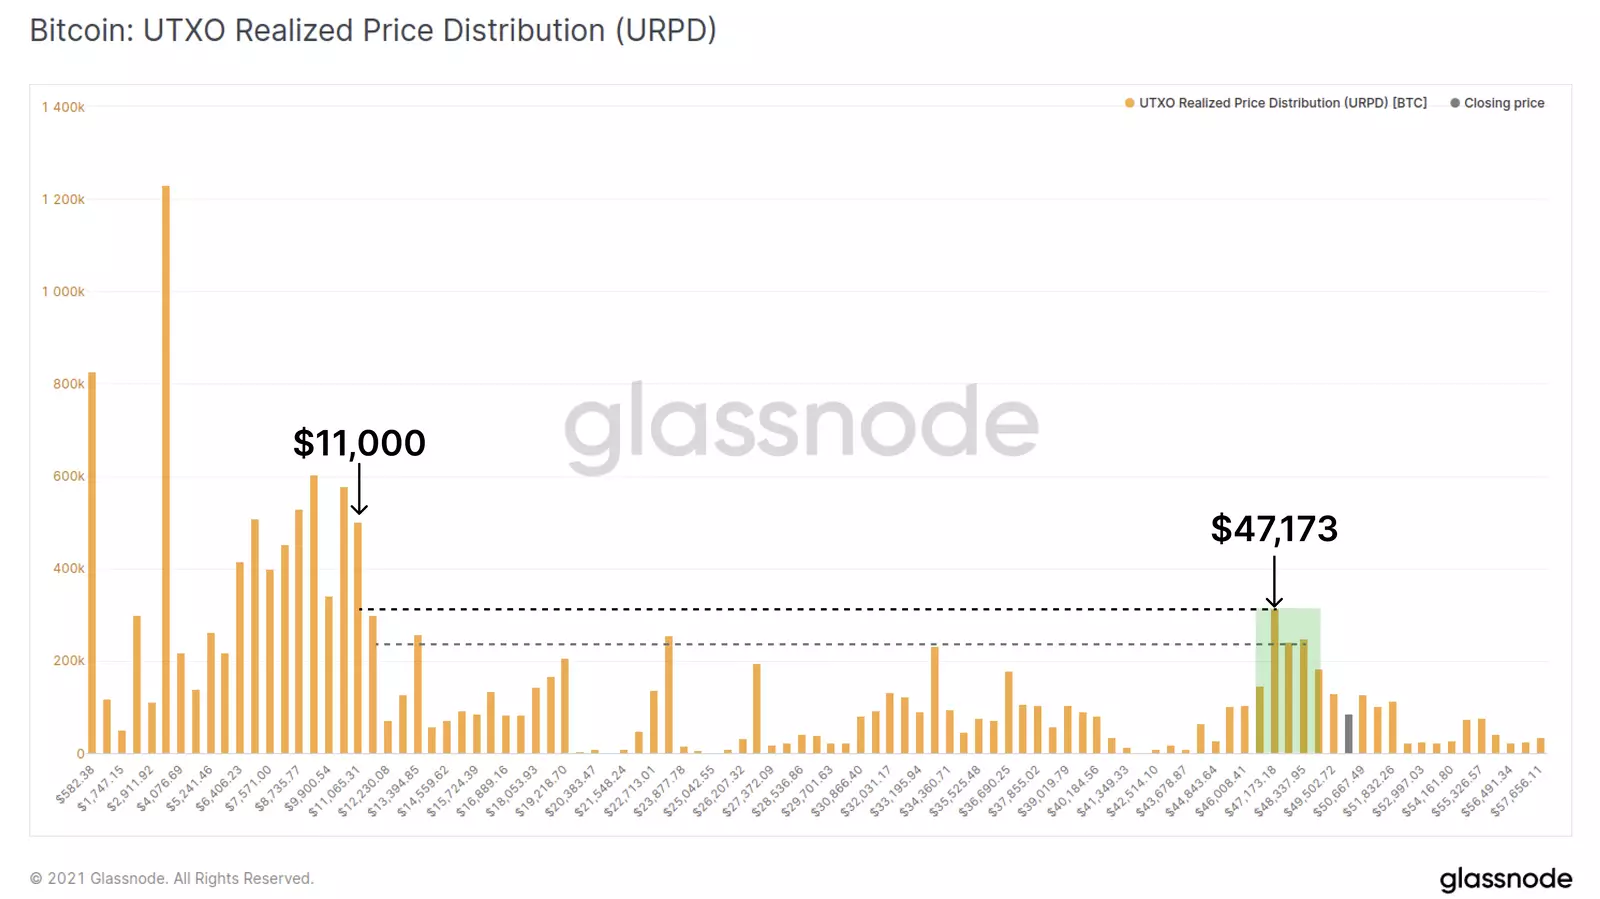
Bitcoin UTXO chart
Transaction volume alone is not an exclusive indicator for accumulation because selling activity could also be high. However, Bitcoin Balance on Exchanges metric continues to drop, whereby roughly 35,200 BTC left the trading platforms over the last seven days. Exchange outflow is a bullish signal. It implies that investors prefer their coins to be illiquid. On the other hand, this means that supply in exchanges is dropping appreciably amid increased demand.
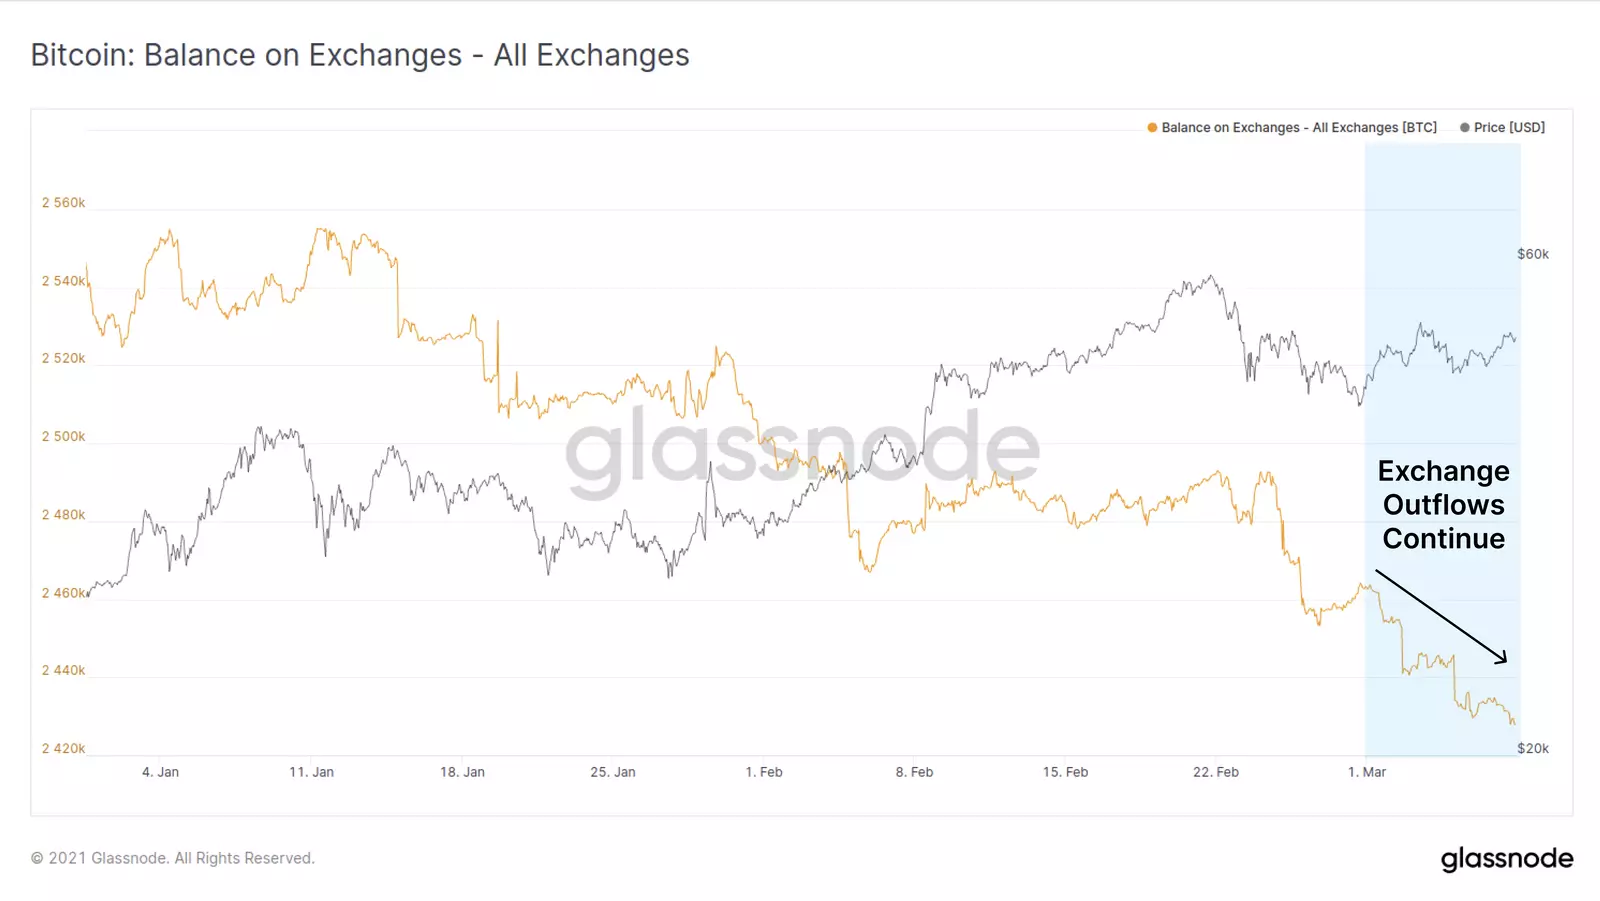
Bitcoin Balance on Exchanges model
Consequently, on-chain data unveils that miners are currently bullish on Bitcoin. However, we have to keep in mind that they are natural sellers of BTC to cover operation and electricity expenses. The Miner Position Change metric tracks all the balance for the Bitcoin that has been mined recently.
The chart shows that miners started to sell less in February, and the rate has continued to shrink. In other words, they are going back to a neutral or an accumulation mode.
-637508827342511266.png)
Bitcoin Miner Position Change model
Bitcoin commence significant technical breakout
The flagship cryptocurrency is trading above a key ascending triangle pattern on the 4-hour chart. Trading above this pattern is a massive bullish signal because it has a 17% breakout target of $60,975.
An ascending triangle is a bullish continuation pattern., highlighting a period of consolidation before an upswing. It is also characterized by low trading volume during its formation, but the volume increases greatly on slicing through the x-axis.
The short-term technical picture shows that Bitcoin’s least resistance path is upwards. The Moving Average Convergence Divergence (MACD) cross above the signal line has confirmed its ongoing uptrend. The bellwether cryptocurrency needs to secure higher support, preferably above $54,000, to add credence to the anticipated upswing above $54,000.
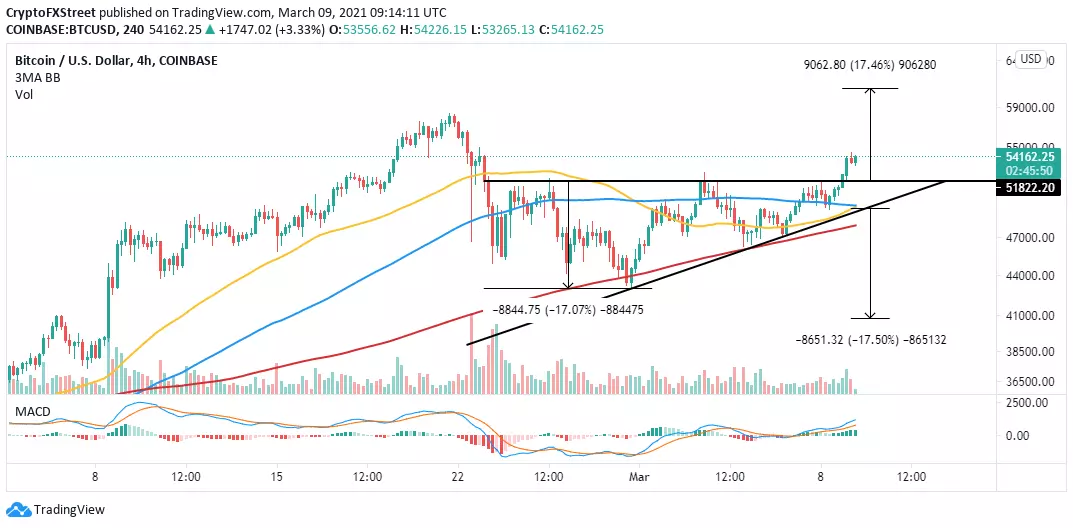
BTC/USD 4-hour chart
A reversal will come into the picture of Bitcoin fails to hold onto support at $54,000. Retesting the triangle’s x-axis may lead to a rebound. However, if the price slices through the support, Bitcoin will drop to explore levels under $50,000. Note that the 100 Simple Moving Average (SMA) and the 50 SMA are in line to provide support above $49,000.
Author

John Isige
FXStreet
John Isige is a seasoned cryptocurrency journalist and markets analyst committed to delivering high-quality, actionable insights tailored to traders, investors, and crypto enthusiasts. He enjoys deep dives into emerging Web3 tren




