Bitcoin Price Prediction: A falling knife or Michael Saylor’s sword in stone pt.2
- Bitcoin price auctions just below an Elliot Wave trend channel established in 2019.
- BTC price shows bullish divergence between Wave 2 and Wave 4 on the Relative Strength Index.
- Invalidation of the macro thesis is a breach of Wave 1 at $13,880.

Bitcoin price is still very bullish according to macro technicals. A modest $80,000 target is still in the cards for the future, but defining a market bottom remains the true challenge. MicroStrategy CEO Michael Saylor stands by a similar bullish bias.
Bitcoin price is unfazed on larger time frames
Bitcoin price has traders in a frenzy this week as the bears have managed to suppress the price below the psychological $20,000 barrier. While many day traders see no hope for the peer-to-peer digital currency, the current selloff is still viewed as a discounted price amongst long-term investors such as MicroStrategy CEO, Michael Saylor. According to Saylor, Bitcoin is supremely undervalued and “it is only a matter of time before the world finally realizes" the importance of a non-inflated peer-to-peer digital currency.
Bitcoin price, at the time of writing, trades at $19,340. Historically, Bitcoin has never spent more than one month within the $19,000 region. In December 2017, BTC price traded briefly near the $19,000 level before plummeting to $3,850 during the Coronavirus pandemic. BTC price spent just a short period of four weeks within the $19,000 region during November 2020 before rallying into the 2021 high at $64,895.
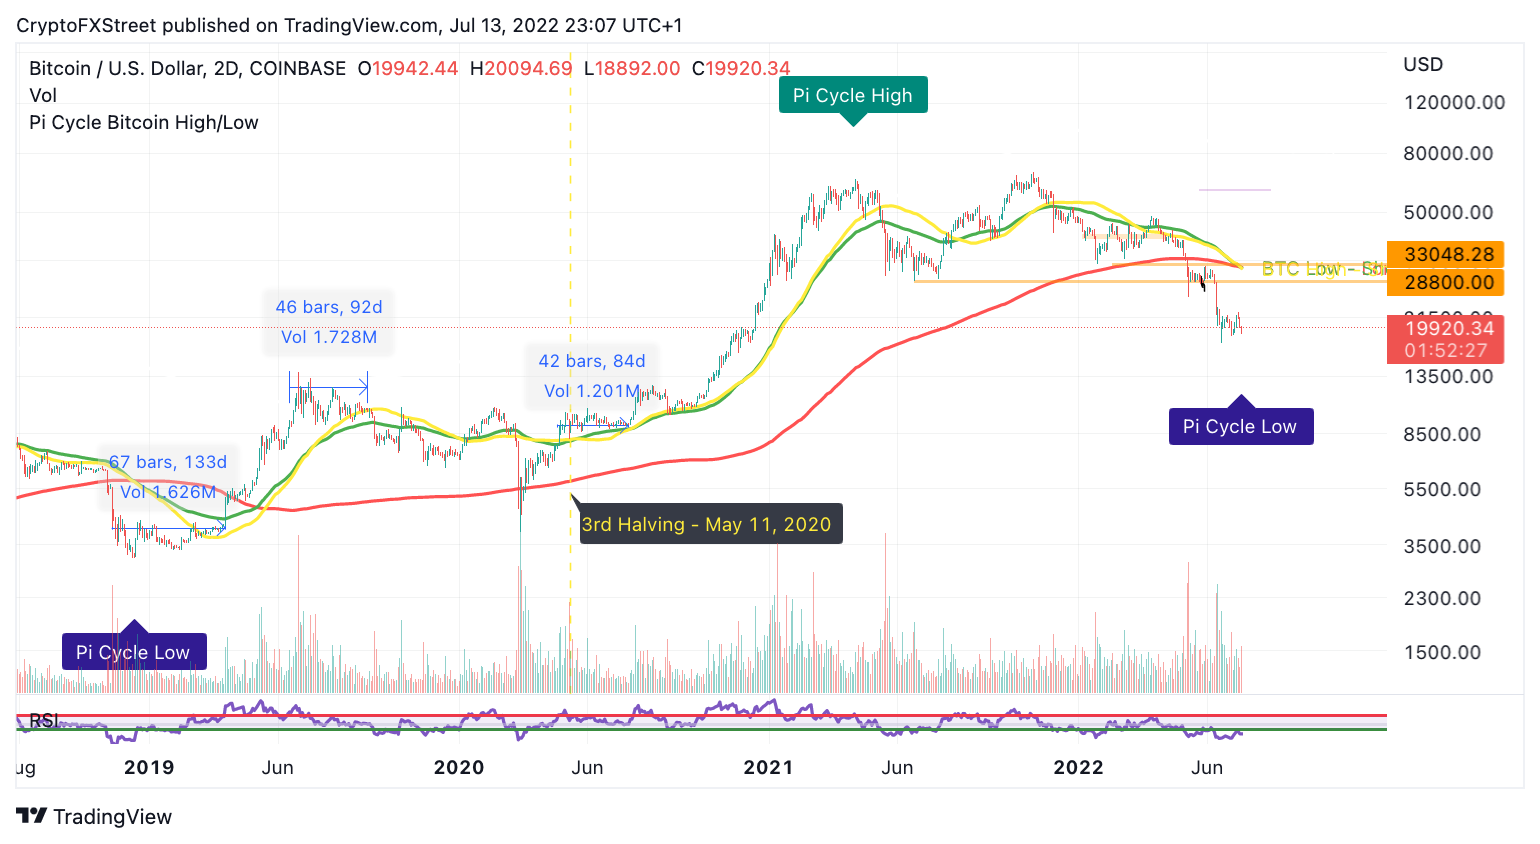
BTC/USD 2-Day Chart
What is Bitcoin trying to tell us?
The $19,000 level can be viewed as a barrier to entry. Smart money does not spend much time in the region before sharp advances occur. Thus, traders may need to pick sides soon. Are you a bull or a bear?
Bitcoin price hovers just below an Elliot Wave parallel trend channel for the third week in a row. Early evidence of a market bottom could be a breach and close above the channel currently positioned at $21,222.
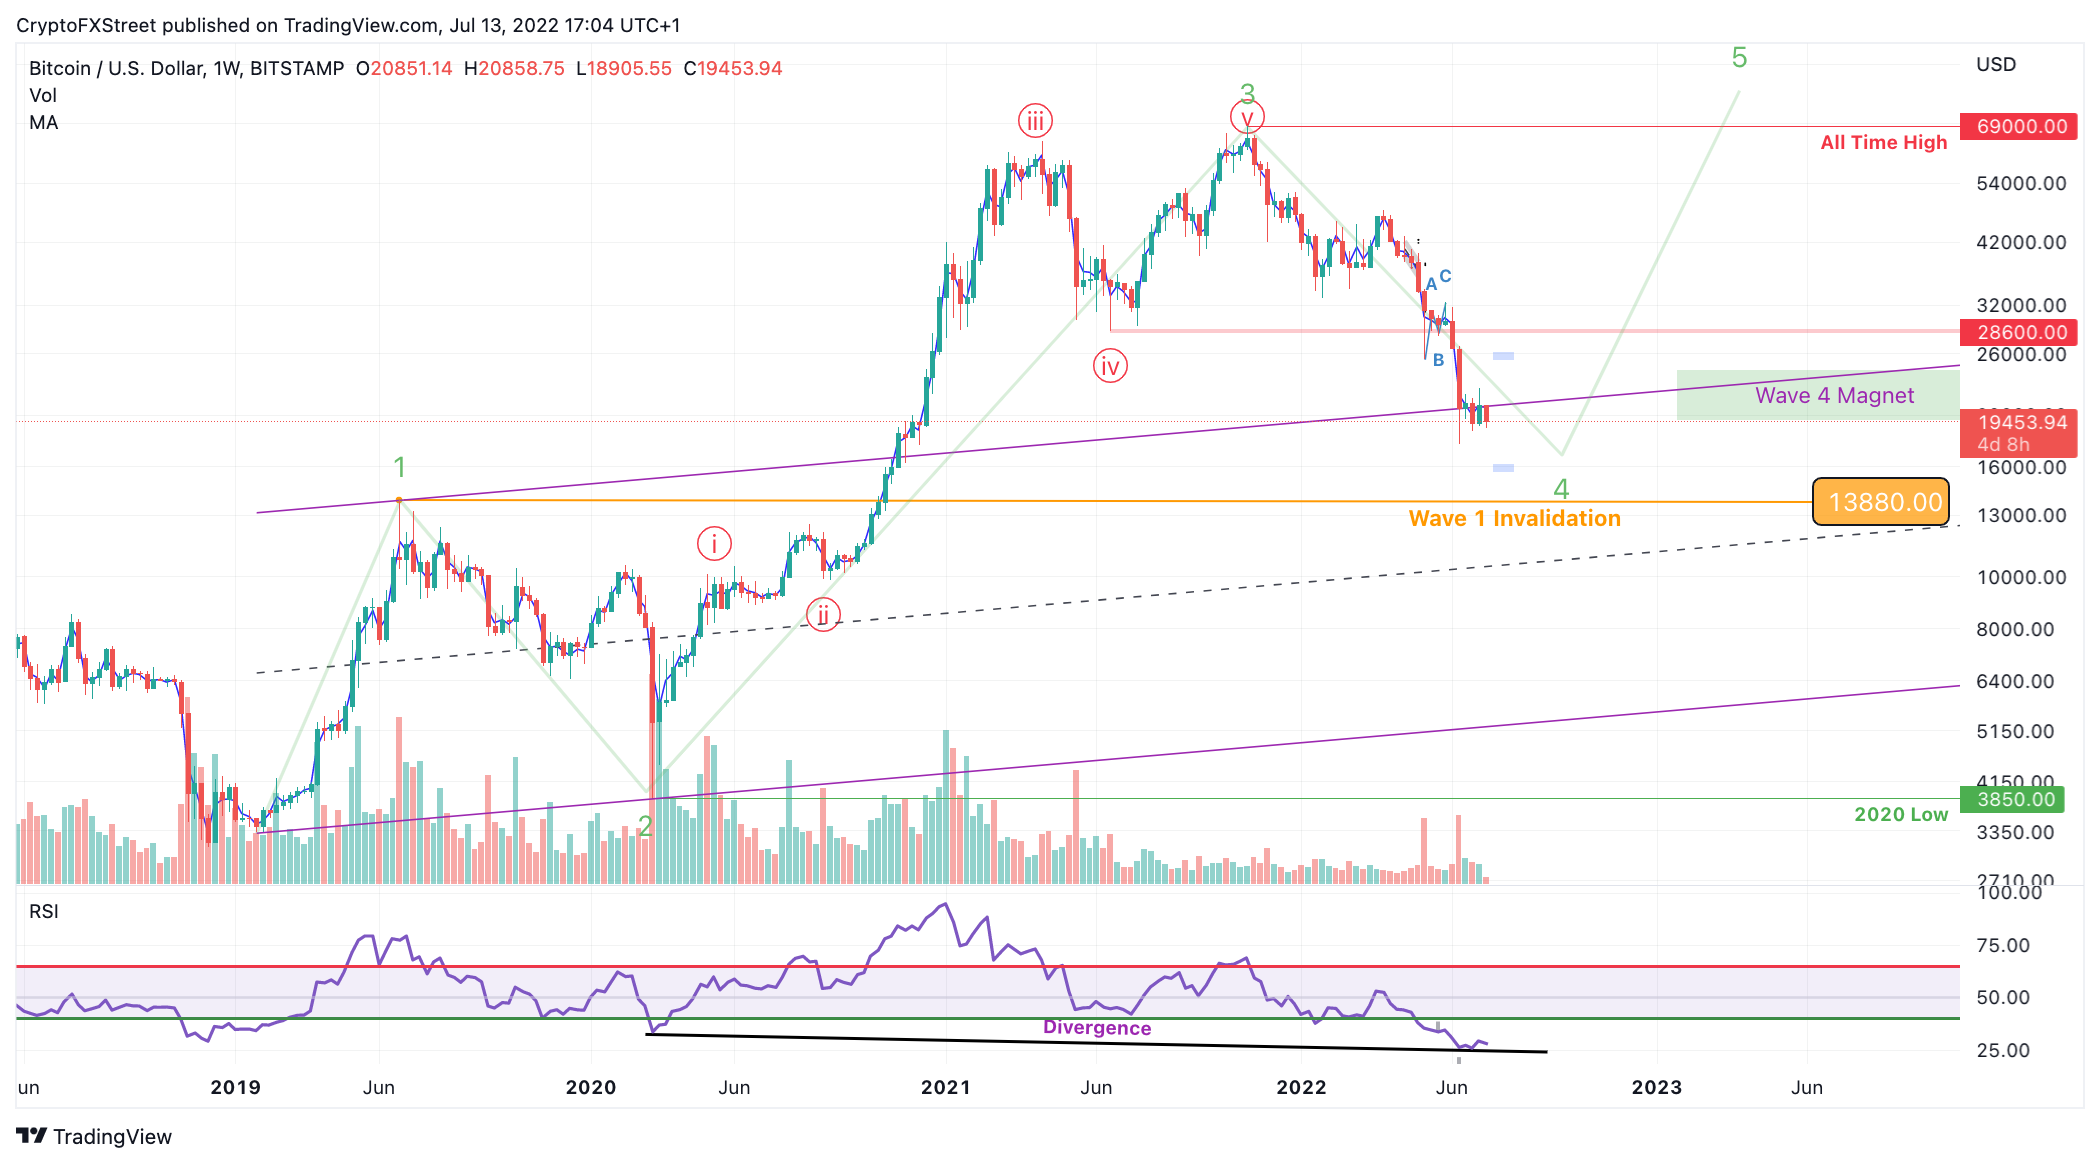
BTC/USDT 1-Week Chart
From an Elliot Wave perspective, the Bitcoin price still has a chance of becoming Michael Saylor’s Elixir. The Relative Strength Index (RSI) confounds the Elliott Wave's bullish thesis on weekly and daily time frames. Notice the bullish divergence between Wave 2 at $3,875 and the current price level at $19,400. The RSI suggests Bitcoin's current value at $19,400 is more oversold than when the Bitcoin price traded at $3,850 during the pandemic lows of 2020.
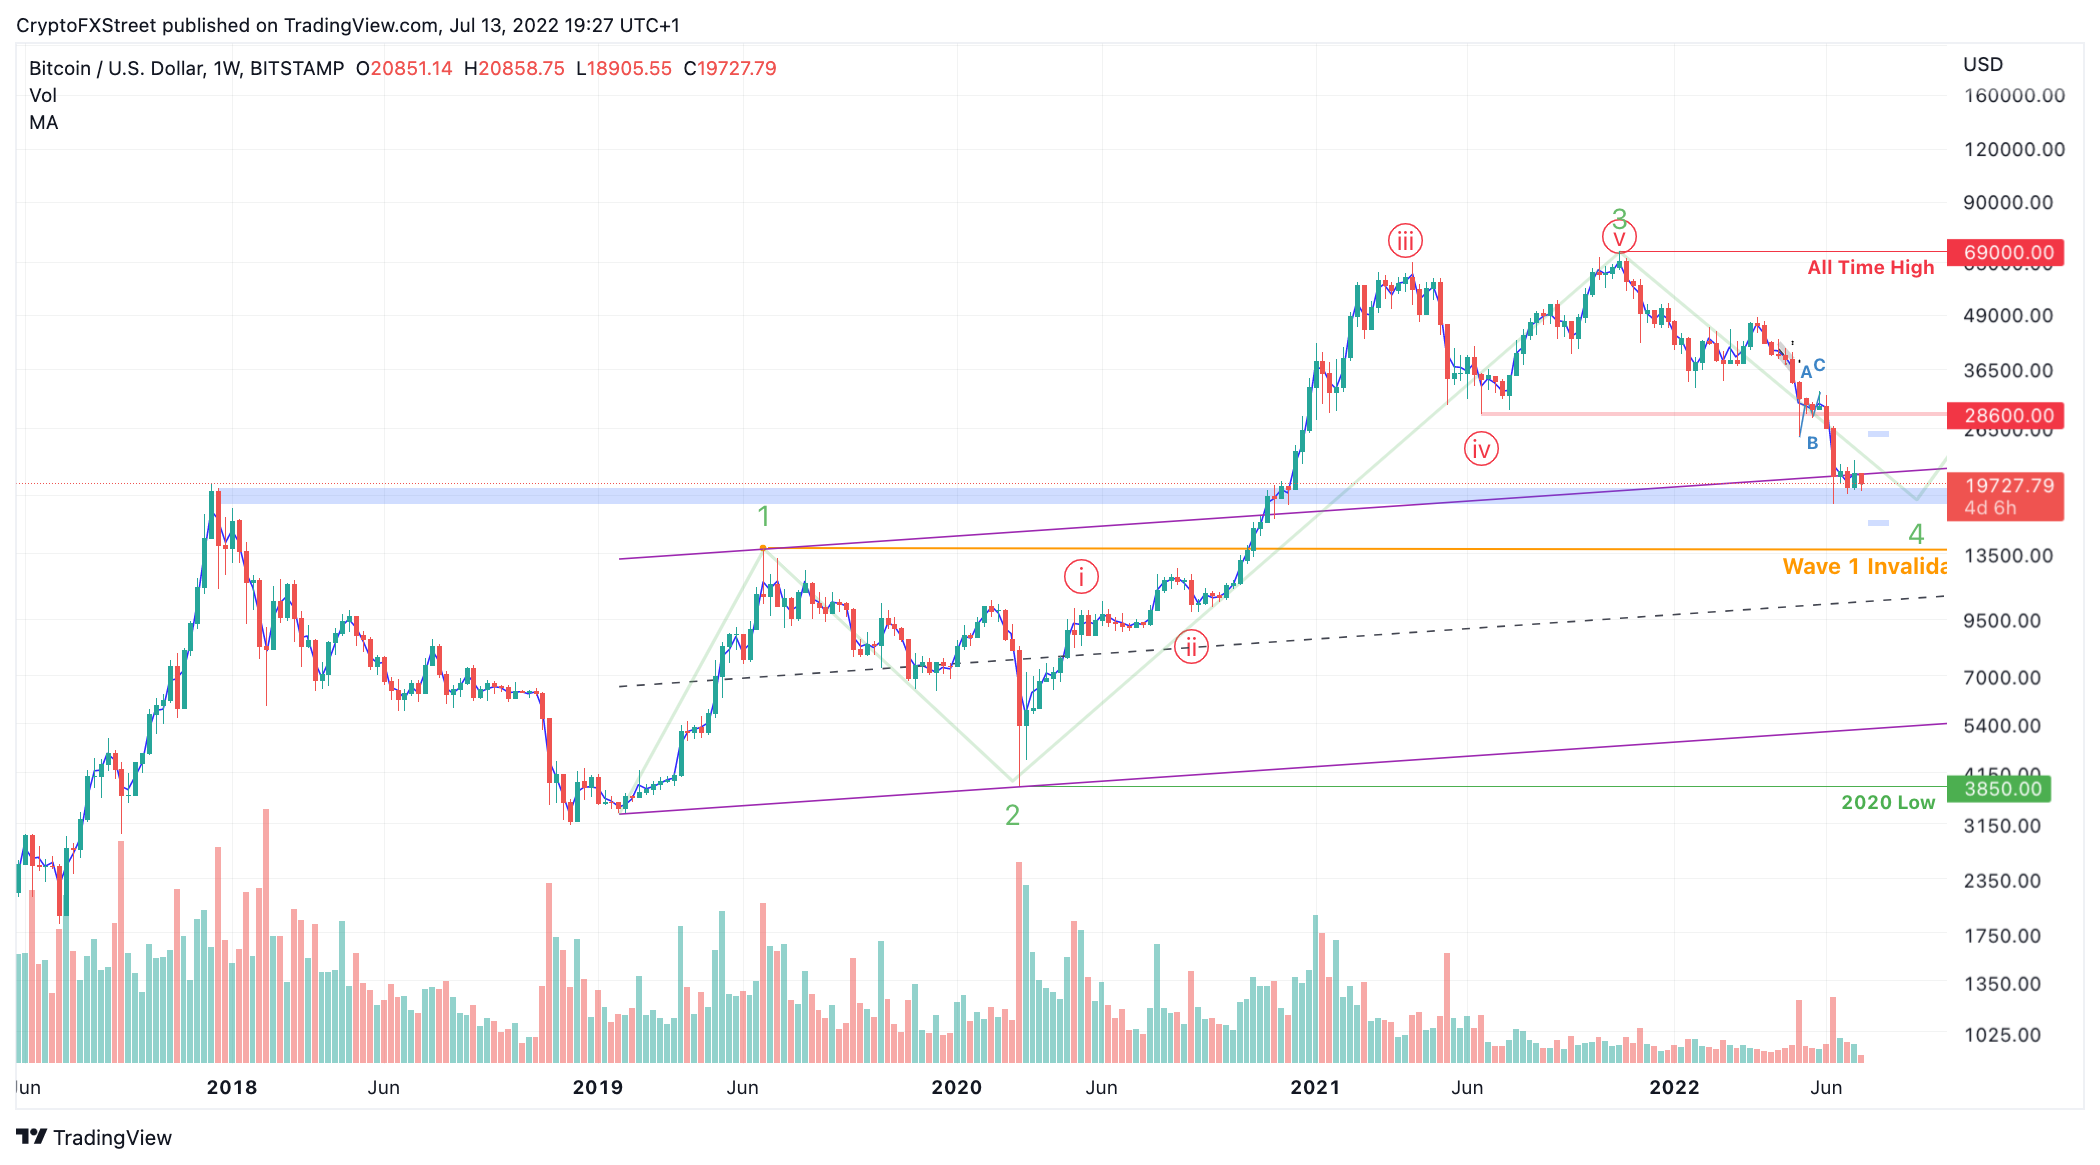
BTC/USDT 1-Week Chart
If Bitcoin is indeed auctioned in a time-consuming Wave 4, then there is still a chance for a future Wave 5 bull run in the future. Conservative targets would be the all-time highs at $69,000. There are multiple reasons to believe in an $80,000 target, but this thesis is not intended to be a fantasy/FUD post.
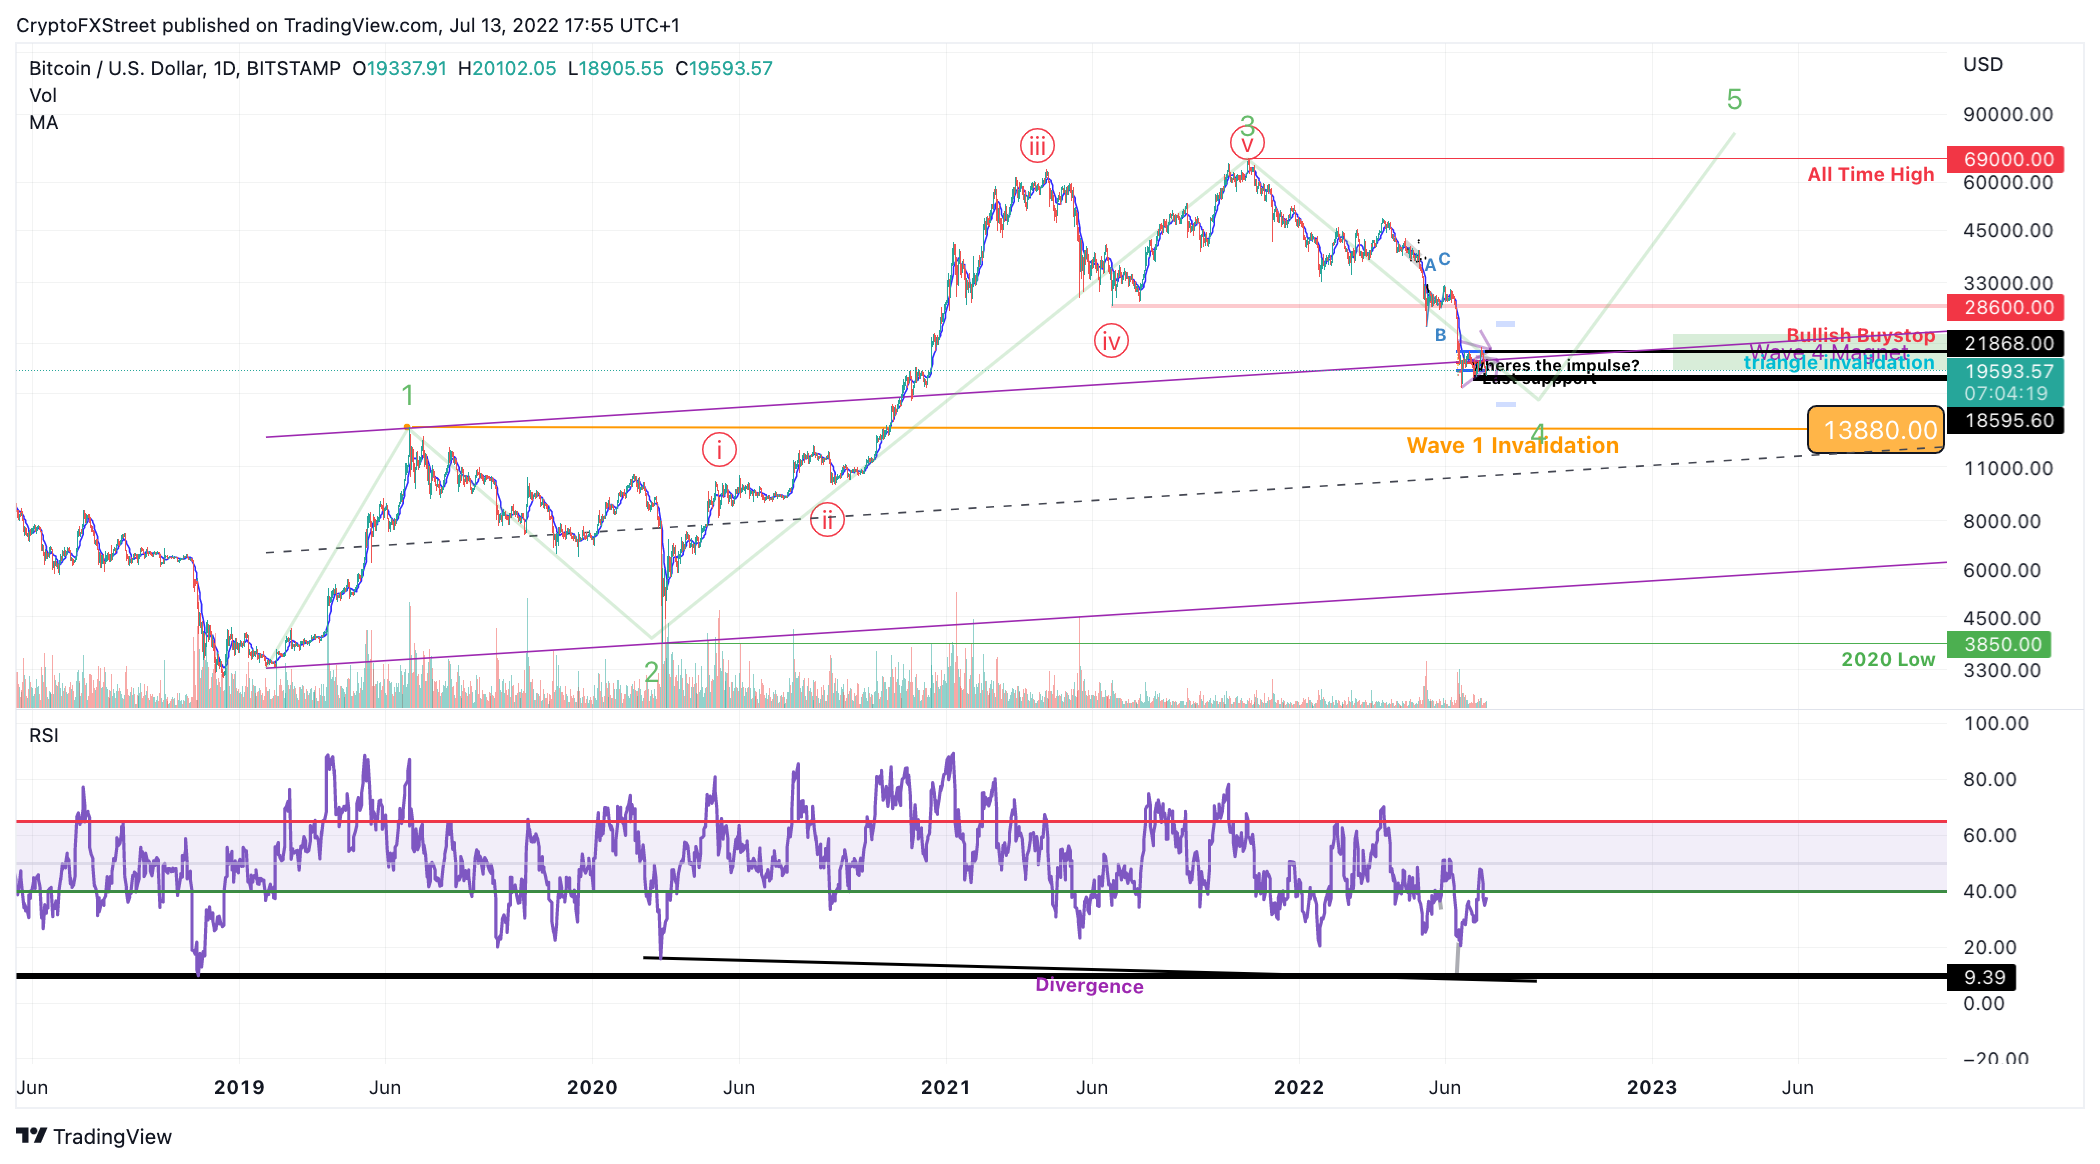
BTC/USDT 1-Day Chart
Invalidation of the bullish macro thesis remains Wave 1 at $13,880. If $13,880 is breached, cryptocurrency will likely be in a bear market for years to come. The bears should have the strength to likely grab liquidity under CME gaps at $10,000. Additionally, they could potentially liquidate the pandemic lows at $3,850, resulting in an 80% decline from the current Bitcoin price.
Author

Tony M.
FXStreet Contributor
Tony Montpeirous began investing in cryptocurrencies in 2017. His trading style incorporates Elliot Wave, Auction Market Theory, Fibonacci and price action as the cornerstone of his technical analysis.


